Utah Voter Turnout
Historically, Utah has been a state with low voter turnout. That began to change in 2014 with the adoption of mail-in voting.
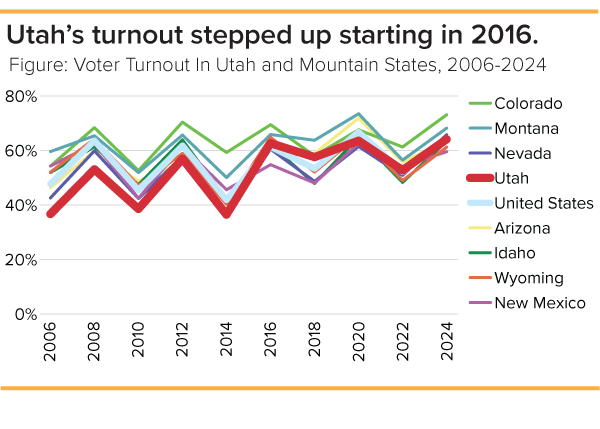
You can see from the graph above that turnout usually follows a cyclical pattern. Presidential election years see an average turnout of 60% from 2008 to 2024. Non-presidential elections see an average turnout of 44% from 2006 to 2022.
Municipal Elections and Utah County
Municipal elections (those that happen in odd years) have an even lower rate of participation. From 2017 to 2023, Utah municipal elections had an average turnout of 14%
Zooming in on one county, you can see that cities in Utah County outperformed the state average. However, in 2023, the average turnout fell to 14%.
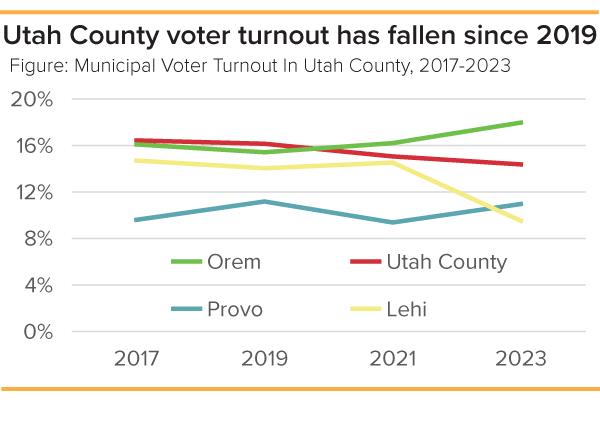 Looking at the three largest cities in Utah County (Provo, Orem, and Lehi), Orem’s turnout has been above average and has surged to 18% in the 2023 election. Lehi trended in the opposite direction, dropping from 14% to 10%. Provo has consistently seen a turnout between 9% and 11%.
Turnout Boosters
Some evidence suggests that turnout can be boosted when additional proposals are part of the election cycle. The non-presidential election in 2018 had a turnout of 57% – much more comparable to the turnout during a presidential election year. This was likely the case because of ballot propositions covering redistricting, Medicaid expansion, and medical cannabis. Early research looking at Utah municipalities also found that when federal congressional special elections are part of standard municipal elections (as in 2017 and 2023), turnout tends to be higher.
Categories: