THERE HAS BEEN A sharp decline in government jobs since the pandemic began affecting Utah’s economy in March. From March to May, nearly 20,000 government jobs disappeared – a 7% decline. This is roughly proportional to the decrease in jobs overall – 6%. This contrasts with the previous recession, when jobs overall decreased 6% from 2008 to 2010 while government jobs actually increased by 3% over the same time period.[1]
 * Image from Utah Foundation, 1970.
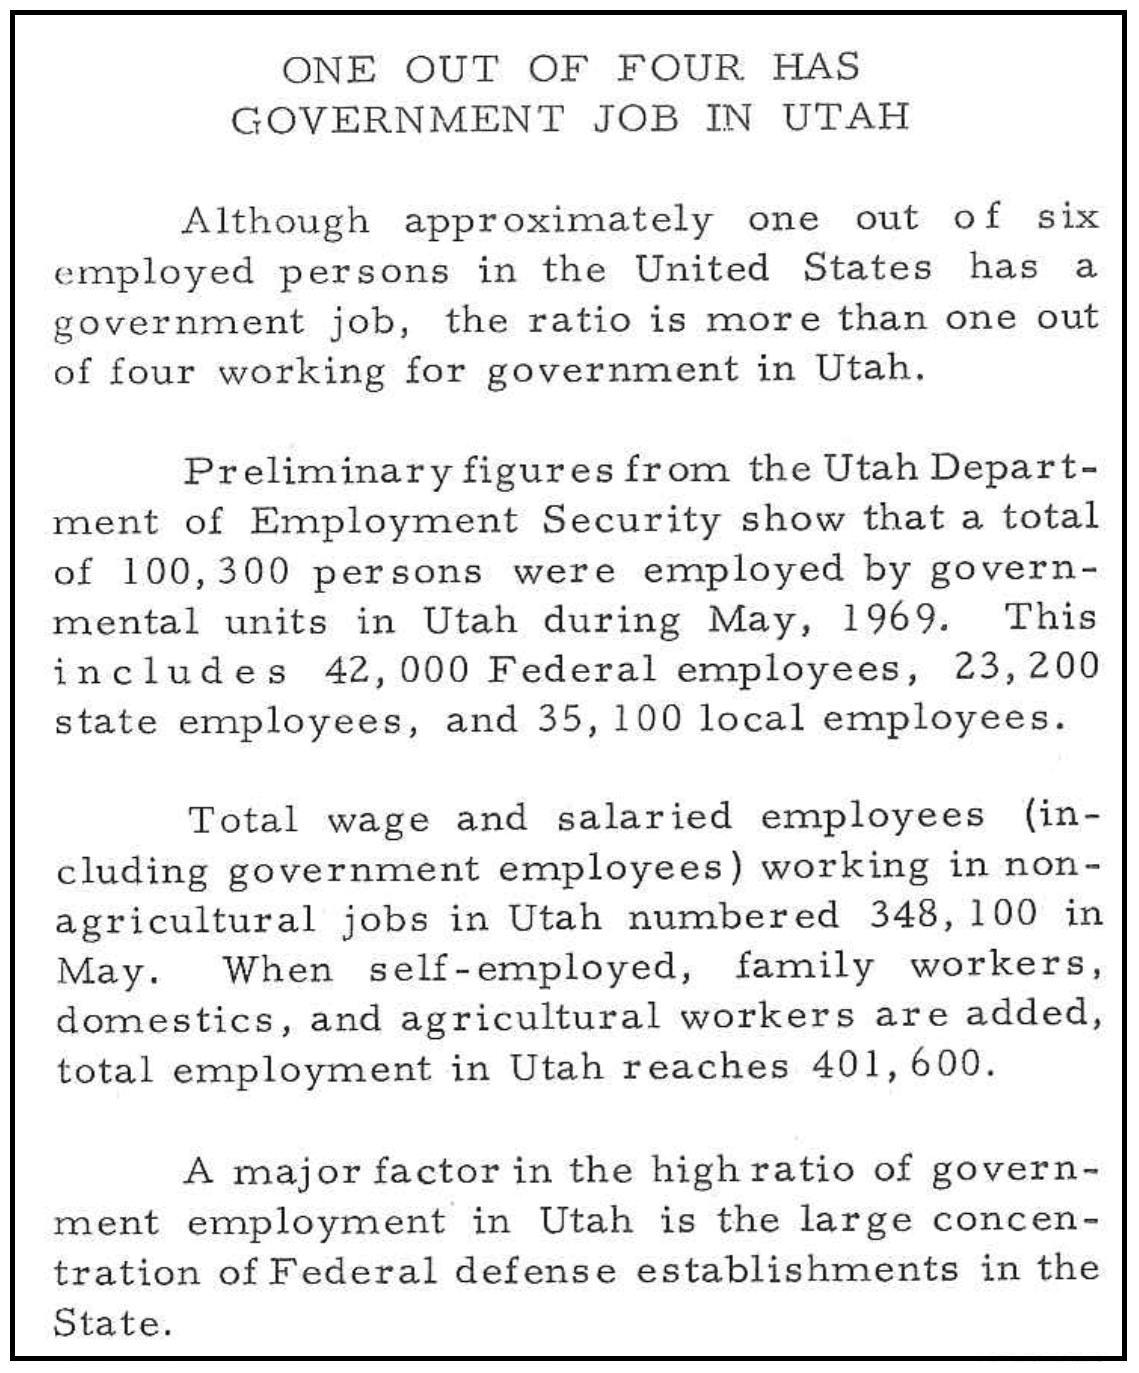
Still, there is a major long-term decline in government employment as a proportion of Utah’s workforce. A half century ago, in 1969, Utah Foundation reported that nearly one-in-four working Utahns were employed by the government, whether federal, state or local.
What would that number look like today? More along the lines of one-in-six as of December 2019. While digging into the information, we noticed that education jobs were not included in the 1969 calculation, despite the salaries for most K-12 and university educators coming from governmental-appropriated funds.[2] If you include those education jobs, it turns out one-in-three Utahns worked for government in 1969, and one-in-five at the end of December 2019.
Government employment in Utah has fallen from 33% to 20% since 1969.
Figure 1: Share of Utahns employed by government, 1969 and 2019
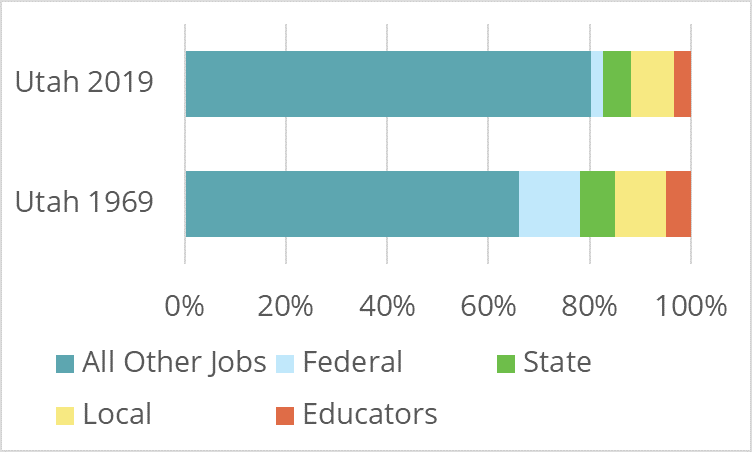
Source: Utah Department of Workforce Services and Utah Foundation. Utah Foundation calculations
Interestingly, there were more Utahns employed with the federal government 50 years ago (42,000) than there are today (36,968), despite there being four-and-a-half times more jobs in Utah overall in 2019. While the number of people employed in state, local and education jobs has increased over the past half-century, they have not increased as fast as all other jobs.
Yet government jobs continue to play a strong role in Utah’s Economy; 13 of the 20 largest employers in the state are government entities. When looking at the top 50, nearly half of top employers are government entities.
Two-thirds of Utah’s top 20 employers are government entities.
Figure 2: Utah’s top employers by number of employees, 2018

* Civilian employment.
Source: Utah Department of Workforce Services.
[1] Bureau of Labor Statistics, Utah Foundation calculations. Source data tables include:
- Utah, seasonally adjusted, total nonfarm, all employees – SMS49000000000000001;
- Utah, seasonally adjusted, education and health services, all employees– SMS49000006500000001;
- Utah, seasonally adjusted, government, all employees; – SMS49000009000000001;
- United States, seasonally adjusted, all employees, education and health services – CES6500000001;
- United States, seasonally adjusted, all employees, educational services – CES6561000001;
- United States, seasonally adjusted, all employees, health care and social assistance – CES6562000001.
State level data breaking out educational services from healthcare services were not available. Utah Foundation estimated the data by calculating the historic share of the educational services industry from the Education and Health Service supersector. National data (which has current breakdowns between educational services and health and social assistance) was used to estimate how job losses were distributed between educational services industry and other supersector industries.
[2] This does not include the small number of private K-12 educators or the larger number of educators from BYU, Westminster, and other private colleges and universities.
Categories: