This post continues our blog series on concerns that many Utah voters expressed in our survey that didn’t make the cut for our top ten list.
Transportation and traffic ranked 16th in this year’s Utah Priorities Project, a similar to the 2010 and 2012 surveys. The highest ranking transportation and traffic has garnered was 9th place in 2008. This year, 49% of respondents gave this topic a 4 or a 5 on a 5-point scale.
 , although the majority of those chose 4 rather than 5. “Job placement” was not far behind at 42%. Very few respondents were concerned about “graduation rates.” Responses were fairly consistent across political party and ideological lines. A higher percentage of Utahns over 50 gave transportation and traffic a 4 or a 5 than did younger Utahns.
Prior Utah Priorities Project blog posts and issue briefs have discussed that respondents felt that infrastructure, both for transportation and water, was an important priority when considering Utah’s future population growth.
One aspect of infrastructure that garnered attention in Utah recently was local roads. A 2015 ballot proposition, Proposition 1, was posed in 17 of Utah’s 29 counties. The proposition allowed voters to decide whether counties could impose a quarter-of-one-percent sales and use tax to be put towards local transportation. Ten counties supported Proposition 1, while the remaining seven (including Salt Lake and Utah counties) did not.
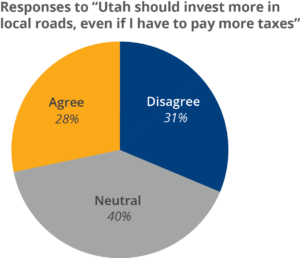
This mixed support for local road funding was also reflected in a follow-up question in the Utah Priorities Project. When respondents were asked if they agreed or disagreed with the statement “Utah should invest more in local roads, even if I have to pay more in taxes,” only 28% agreed.. The largest portion of responses were neutral (40%), and the remaining 31% disagreed. A slightly higher percentage of men agreed than women (31% vs 25%), and a higher percentage of Democrats agreed than Republicans (39% vs 26%).
These findings connect with an additional follow-up question focusing on government spending. When given four different options as their top priority for government spending (education, transportation, law enforcement, or healthcare), respondents chose transportation least often (5%).
Categories: