Food plays an essential role in building healthy communities as it is enmeshed with nearly every social aspect of life. Romantic connections are made over meals, family connections are strengthened by daily dinners, celebrations are defined by the unique dishes served, and business deals are built over lunch. More broadly, national and regional identities can be defined by foods distinct to the area and the sharing of food is a universal gesture of hospitality. Food not only plays an essential role in building the social fabric of communities, but it is essential in developing healthy individuals in those communities. This report explores the level of food security in Utah and lists policies and programs that community partners are embracing to ensure enhanced food security for all.

Healthy Communities Series
The Utah Foundation’s Healthy Communities series of reports explores policy options contributing to Utahns’ quality of life in an environment of increasing populations, an increasing scarcity of open space, rising prices, food insecurity, and the need to create safer and more equitable streets and infrastructure. This series is part of the Utah Foundation’s Better Beehive Files.

Key findings
- Nearly 11% of Utahns are food insecure. Certain demographic groups have higher rates, including seniors, immigrant communities, communities of color, urban core residents, and rural communities.
- Numerous people and organizations across Utah – such as policy makers, governments, and nonprofits – are working together to help alleviate food insecurity.
- Food-related programs based in schools can improve childhood food security.
- Utah has low enrollment levels in federal food programs, especially among seniors.
- Farmers markets, community supported agriculture, and community gardens can help make healthy local food more accessible, while income-targeted programs related to each will make food more affordable.
- Utah is one of few states without a food hub to help manage the aggregation, marketing, and distribution of food sourced from local producers.
- Empowering convenience stores with the knowledge and resources to serve healthier food could increase food security in food deserts.
- Food waste diversion programs and local food pantries can help alleviate food insecurity.
Food Security
Food security is defined differently by different organizations. The 2021 Utah Legislature defined food security as “access to sufficient, affordable, safe, and nutritious food that meets an individual’s food preference and dietary needs.”1 By contrast, the U.S. Department of Agriculture (USDA) defines food insecurity as the lack of consistent access to enough quality or desirable food for every person in a household to live an active and healthy lifestyle.2
A household with high food security or low food insecurity is a household in which all family members always have access to enough food for an active and healthy life. A household with low food security or high food insecurity is a home in which one or more residents’ food intake is reduced and/or eating patterns are disrupted because of budgetary constraints.
There are also different levels of food insecurity. USDA defines marginal food security as when households feel anxiety or have problems at times accessing adequate food, but the quality or quantity of the food consumed is not substantially reduced. Low food security is when quantity is maintained, but households must rely on cheaper, less desirable, or lower quality options. Very low food security is when households have had to reduce the quantity of food for one or more members.3
Food Insecurity in Utah
The USDA estimated that an average of 10.7% of Utah households experienced food insecurity between 2020 and 2022.4 Even more dire is the reality that 4% of Utahns exhibit very low food security which is defined as simply lacking the ability to buy enough food.
That said, food insecurity has declined by four percentage points (or 26%) in the last two decades. Utah is still above the 2016-2018 average.5 (See Figure 1.)
Utahns’ food insecurity has generally decreased from 2001, but is up since 2018.
Figure 1: A Three-Year Average of Food Security in Utah, 2001 to 2022
Source: USDA Food Assistance and Nutrition Research Reports on Household Food Security in the United States, 2001 through 2022.
Nationally and in Utah, certain demographic groups – seniors, immigrant communities, communities of color, urban core residents, and rural communities – are disproportionately at risk for food insecurity.6 Many seniors have low or fixed incomes and face mobility challenges. Immigrant communities may face linguistic challenges or difficulty finding culturally important food. They may also face similar challenges when applying for food aid. This can be compounded by the social stigma related to using these programs and a fear that using them will negatively affect their residency status, immigration status, or even result in deportation.7
Communities of color also tend to have higher rates of insecurity. Nationally, both Black and Hispanic households experience food insecurity rates double those of their white, non-Hispanic counterparts.8 In Utah for example, San Juan County – where 52% of residents identify as Native American – reports food insecurity at more than double the state average.9 Finally, both urban cores and rural areas are more likely to see higher levels of food insecurity than suburban areas.10
Barriers to Food Security
The two main factors that heighten the risk of food insecurity are finances and the physical distance to food.11 These factors affect an individual’s shopping frequency, the time it takes to travel to the nearest store, and the overall or relative costs of items.
Relatively long distances to high-quality food on a community-wide scale generate what are referred to as food deserts. Generally, food deserts are areas lacking full-service food stores selling fresh produce, vegetables, and other grocery staples.12 More specifically, these deserts exist when cities lack food options within a half mile to one mile or when rural communities lack these food options within 10 miles. The effect upon health is clear as people living in food deserts eat fewer fruits and vegetables.13 As of 2018, there were over 800,000 Utahns living in food deserts with a tendency for them to be concentrated in low income areas.14
|
Sidebar: Healthy Food While this report primarily focuses on food insecurity in broad terms, there are levels of food insecurity to be explored. One of the levels is individuals or households switching from high or average-quality food to often cheaper but lower-quality food. Many Utahns are not meeting scientifically based recommendations for healthy food. The U.S. Department of Agriculture recommends a consistent dietary pattern tailored to cultural, traditional, and personal preferences of various nutrient-dense foods such as leafy greens, fruits, and whole grains, while limiting one’s intake of saturated fats, sodium, and added sugars.15 However, adults and children in Utah – like Americans in general – consume fruits and vegetables less frequently than the daily federal recommendations. Of Utah’s adult population, 37% have fewer than one fruit daily and 20% consume fewer than one vegetable daily.16 Similarly, 41% of adolescents in grades 9-12 are not even eating one daily serving of fruit and 36% are not eating one daily serving of vegetables.17 Too many sugary drinks or too much fast food can also be problematic nutritionally and represent its own path toward food insecurity for certain groups. Two-thirds of Utah children over five years old consumed at least one sugary beverage per week in 2021 – nearly 10 percentage points higher than the national average.18 Similarly, over half of Utah adults consume one or more sugary beverages daily.19 As a parallel, fast food is also cheap, convenient, filling, and calorie-rich. People may be unable to consume more healthy foods due to a lack of time to make food, the cost of food, and overall fast-food availability. |
Costs of Food Insecurity
The lack of fresh and healthy food – in conjunction with the high consumption of processed foods and sugary drinks – puts people at a higher risk of experiencing obesity, cancer, diabetes, and heart disease.20
Health costs also translate into financial costs for households and communities. Annual medical costs for people with high blood pressure are up to $2,500 higher than costs for people without high blood pressure.21 Total direct medical expenses for diagnosed diabetes in Utah were estimated at $1.3 billion in 2017.22 In 2009, Utahns incurred $953 million in obesity-related healthcare costs.23
Certainly, food insecurity is not solely to blame for all these costs as exercise also plays a role. Still, studies in both Canada and the United States have found that food-insecure households spend more on health care costs. The U.S. study found that food-insecure households spent roughly 45% more on medical care in a year than people in food-secure households – $6,100 compared to $4,200.24
What’s more, some communities include numerous demographic groups with higher rates of poorer health outcomes. For example, rural areas of the state tend to have higher rates of obesity and are also more likely to be considered food deserts. People living in food deserts have been shown to have higher blood pressure, even when considering demographics and income.25
Addressing Food Security
Utah as a state and groups within the state are addressing food security on several levels. However, most of these decisions are ultimately made by individuals. These methods of addressing food security are largely about giving Utahns agency and access to choose healthy, affordable, and fresh food.
There is a wide array of policy solutions that could help with Utahns’ food access and quality.
Figure 2: Potential Policy Solutions
|
Goal |
Actors |
Page |
|
|
State Task Forces and Councils |
Access/equity |
Public/private |
|
|
Among Children |
|||
|
School Meals |
Access |
Public |
|
|
School Pantries |
Access/equity |
Public/private |
|
|
School nutrition, garden, and farm programs |
Nutrition |
Public/private |
|
|
Among Low-Income Populations |
|||
|
Federally-funded programs supporting food security |
Access |
Public |
|
|
SNAP and WIC enrollment |
Access |
Public |
|
|
SNAP and WIC usability |
Access/nutrition |
Public |
|
|
Local efforts |
Various |
Public/private |
|
|
Produce Initiative Programs and Farmers Markets |
Nutrition |
Public/private |
|
|
Community Supported Agriculture |
Access/nutrition |
Private |
|
|
Food Hubs |
Access/nutrition |
Private |
|
|
Suburban, Urban and Community Gardens |
Access/nutrition |
Public/Private |
|
|
Community Mapping |
Access |
Public |
|
|
Healthy Food Stores |
Quality/equity |
Private |
|
|
Food Waste Diversion |
Efficency |
Private |
|
|
Local Food Pantries |
Access |
Public/Private |
State Task Forces and Councils
In 2021, the Utah Legislature passed Senate Bill 141 to increase access to food for all Utahns. The bill created a Task Force on Food Security to “develop an evidence-based plan for establishing food security in this state.”26
The task force put forward the following conclusions:27
- Identify opportunities to strengthen the network of food pantries and the Supplemental Nutrition Assistance Program (SNAP) and identify educational outreach opportunities for federal nutrition programs in order to increase enrollment.
- Focus upon specific demographics such as children and school programs, seniors, and immigrants who need extra support and specialized programming.
- Identify public policies that would increase economic stability and public awareness while reducing the demand for food assistance programs such as community food pantries.
- Identify policy barriers that prevent low-income individuals and families from participating in federal nutrition programs while identifying opportunities to increase access to fresh and whole foods through community-based programs as part of a healthy diet.
- Address income inequality and housing affordability as long-term solutions to create lasting systemic change.
In 2022, the Utah Legislature passed Senate Bill 133 which created the Utah Food Security Council composed of state, tribal, and nonprofit members.28 Headquartered at Utah State University, the Council is tasked with working to identify policy recommendations for the Utah Legislature regarding access to healthy foods, outreach, community services, and economic stability.29 Members of the Council acknowledge that food insecurity is a symptom of broader financial insecurity. They want to implement lasting policy solutions that address this aspect of the issue and increase access to food for all Utahns.30
Among Children
Schools provide the primary method of intervention for children. Many schools can provide breakfast and lunch. The localized nature of the public education system means schools are well integrated in the community to possibly serve as food distribution centers and can help children understand the importance of being healthy and which foods are most nutritious.
School Meals. Numerous studies show that students who eat a nutritious breakfast perform better, have better attendance, and tend to behave better than students who do not eat breakfast. They experience higher academic achievement and specifically tend to improve in vocabulary, math, and standardized tests.31 When healthy breakfasts are not available in the home, school breakfasts can fill that role.
Recent studies have found that updated nutrition standards have made school meals healthier.32 Healthy school lunches have also been shown to have high nutrient content correlating with better health outcomes related to diabetes and obesity.33 Implementing healthy dietary patterns at a young age also increases the chance of continuing consistent healthy dietary patterns into adulthood and this could decrease the future rate of adult obesity.34 Finally, schools can choose to participate in the afterschool snack/meal programs, providing yet another point of food access for children living in food insecure households.
On average, nearly 83,000 Utah students ate daily a free or reduced-priced school breakfast in the 2020-21 school year. More than 275,000 Utah students had a free or reduced-price school lunch.35 For some children, school-provided meals may be the only nutritious meal they eat due to household food insecurity. However, some evidence suggests that Utah’s school nutrition programs are underutilized. In Utah, only 40% of students eligible for free or reduced-price breakfasts actually use them – ranking last in school breakfast program participation nationwide.36
The role of nutritious breakfasts and lunches for children is clear. Policymakers at national, state, and local levels are considering what level of school breakfast and lunch to support.
At the national level, U.S. House of Representatives introduced the Universal School Meals Program Act of 2021, which would work in several ways if passed into law:
- Fund breakfast and lunch in schools at no charge for all children.
- Increase meal reimbursement rates to match USDA recommendation.
- Provide free after-school meals, summer meals, and snacks to all children.
- Expanding summer food benefits to all low-income children.
- Provide three meals to children in childcare.
- Provide a 30-cent reimbursement for schools that use local foods.37
At the state level, Vermont, Colorado, Maine, and California have been the first to establish universal free school meals.38 As a step along this path, the Utah Legislature passed the Smart Start Utah Breakfast Program bill which requires all public schools participating in the National School Lunch Program to also adopt the School Breakfast Program and offer alternative breakfast service models if a certain percentage of students qualify for free or reduced-priced lunch.39 The bill also requires schools with 30% or more of their students applying for free or reduced-price meals to provide the option for students to receive breakfast after the school day begins.40
At the state and local level, the Community Eligibility Provisions program is a free meal option for schools and school districts in low-income areas. It differs from National School Lunch Programs in that it does not require household applications and the program costs are reimbursed by one of two federal programs: SNAP or Temporary Assistance for Needy Families.41 Of the sixty eligible or near eligible schools in Utah, fifty have adopted Community Eligibility Provisions.42 The program is looking to reduce the eligibility threshold for schools which would allow 202 schools and nearly 350,000 students in Utah to become eligible for no-cost school meals.43 The recommended change would give more schools and school districts the option and flexibility to invest non-federal funds into offering no-cost meals to all enrolled students.
State and local officials also have the option of extending the pandemic-era program, Healthy School Meals for All. This program provided one million additional breakfasts and 7.5 million additional lunches to Utah students.44 A study of the program showed that participants consumed healthier meals than non-participants. While the food costs increased, food service directors reported the program required no additional staffing hours.45 This pandemic-era bill was passed, funded, and then extended until June 2022, but the continuation of the universal meals is now up to state and local authorities.
School Pantries. There are three education-centered pantry models in Utah’s healthy school toolkit: on-site pantries, mobile pantries, and district pantries. On-site pantries benefit schools with adequate space for dried goods and allow for food to be available anytime for families in need.46 However, they can be limited by the physical space needed for shelving and the staff needed to rotate and manage food donations.
All Title I schools in Salt Lake School District that have at least 200 students in need or a poverty rate above 50% are supported by the Utah Food Bank.47 The Food Bank offers mobile food services through the Kids Café program.48
The mobile pantry approach has three main advantages: it eliminates the need for in-school dedicated space, it can offer fresh food options to families, and the food is secured by an outside organization rather than being run internally. There are limitations, however. There may be long intervals between donations, food availability is only on designated days, and families cannot self-select food items.49
Another approach is that school districts can run pantries to provide consistent district-wide food support. They might offer a wider variety of items such as clothing and hygienic supplies. However, they might require additional staff and delivery vehicles. The Ogden School District created the MarketStar Student Resource Center to meet the needs of all students in the district through community donations and corporate sponsors.50
School Nutrition, Garden, and Farm Programs. As schools are responsible for education, they also can make sure students understand the importance of healthy food and understand where to access it.
Utah’s Farm to Fork program, focused on connecting schools to agricultural education, has three main goals. These are offering universal agriculture education in Utah, increasing market opportunities for small producers, and providing support for school nutrition programs.51 They are approaching this by implementing a Farm to School Advisory board, conducting special events to engage the public, and promoting local food and development by appointing one person to serve as a matchmaker between schools and farmers. The program is also diversifying funding streams to ensure that it maintains relevance and permanency.
Among Low-Income Populations
Policymakers at federal, state, and local levels, even community organizations, are addressing food insecurity within low-income populations in several ways.
Federally Funded Programs Supporting Food Security.
The Supplemental Nutritional Assistance Program (SNAP), previously called food stamps, as well as the Women, Infants, and Children (WIC) programs support low-income individuals and families.52 Although their goals are similar, SNAP and WIC are not the same. Families or individuals eligible for SNAP receive an Electronic Benefit Transfer card preloaded with a monthly dollar amount based upon household income. These cards can be used to buy food at SNAP-accepting stores.53 SNAP is accepted by grocery stores, many convenience or corner stores, and even some farmers markets. SNAP payments can go a long way toward covering families’ grocery store charges.
Unlike SNAP, WIC is based on nutritional needs as determined by a health screening. WIC is for individuals and households. To be eligible, women must be pregnant, breastfeeding, or postpartum. Children are supported until their fifth birthday (regardless of the gender of the guardian).54 The program does not provide a dollar amount to buy food but rather offers categorized food packages, nutrition education, and health screening determined by an individual’s situation. WIC foods must be chosen based on nutritional value as set by the USDA.55
Eligibility for nutritional assistance programs is based upon household poverty, with upper income thresholds ranging from 100 to 185 percent of the federal poverty line. (See Figure 3.) In 2015, SNAP resources nationally helped 8.4 million people get out from under the poverty line.56 In parallel, WIC lifted 279,000 people out of poverty in 2017.57 Notably, the effect of SNAP and WIC was higher in rural areas than in urban environments.58
SNAP benefits are not insignificant.
Figure 3: Utah SNAP Income Eligibility Limits, Effective October 1, 2022
|
Household Size |
Gross Monthly Income Limits – 130% of Poverty |
Net Monthly Income – 100% Poverty |
Maximum Monthly Benefit |
|
1 |
$1,473 |
$1,133 |
$281 |
|
2 |
1,984 |
1,526 |
516 |
|
3 |
2,495 |
1,920 |
740 |
|
4 |
3,007 |
2,313 |
939 |
Source: Utah Department of Workforce Services.
Further highlighting program efficacy, two contemporary studies compared households’ food security before and after receiving SNAP benefits and found that SNAP participation reduced food insecurity and low food insecurity by 17% and 19% respectively.59 The largest effect was seen in families with children which exhibited a 33% decrease after families received benefits for six months.60
Low-income adults participating in SNAP also experienced positive health effects incurring nearly 25% less in annual health care costs relative to low-income non-participants.61 The relative savings are even greater for those with hypertension and coronary heart disease.62
Both programs are far-reaching in their efficacy to reduce hunger across the U.S. However, there are notable areas of potential policy improvements.
SNAP and WIC Enrollment. Streamlining SNAP and WIC program enrollment processes and encouraging all who qualify to participate would further reduce hunger insecurity. This could include educating the public regarding who is eligible for programs, making applications easier, and increasing the ease with which one can retain benefits.63 Less than 80% of people eligible for SNAP statewide are currently receiving benefits.64 Many Utahns that lack access to the internet and/or computers, are often unfamiliar with the application process, or encounter a language barrier in attempting to enroll.
One option for increasing eligibility is the federal Enhanced Access to SNAP Act. The Act would increase SNAP access for low-income college students by equating attending higher education to employment. Employment is required for SNAP eligibility, and this could put SNAP within reach of 2.5 million undergraduate and 500,000 graduate students.65 The bill failed to pass in January 2023.
While SNAP is a federally funded program, states and community organizations have a role in ensuring its success. Investing state or other nonprofit funds into creating and implementing SNAP outreach plans might help rural and urban communities alike.66 State actors can receive matching federal funds of up to 50% of the administrative costs for these outreach activities.67
The state might also consider providing community grants to organizations providing application assistance for populations facing these barriers. For example, the Utah State University-run SNAP nutritional education program, Create Better Health, provides a variety of courses to expand participants’ knowledge of nutrition, budgeting, cooking, food safety, and physical activity. It could also be expanded to provide SNAP onboarding and outreach programs.68 Code for America is another nonprofit that assists state agencies with technology utilization to improve and simplify people’s experiences with the enrollment and re-enrollment process for SNAP, Medicaid, WIC, and Temporary Assistance for Needy Families.
SNAP is also an important program for older Utahns, particularly those on fixed incomes such as Social Security. Only 40% of eligible seniors in Utah are enrolled in SNAP, compared to 81% of eligible seniors across the U.S.69 This is at least partially related to seniors experiencing discomfort using the internet and the complexities in applying for and retaining SNAP benefits.70 Further, enrollment might be influenced by a sense of pride in their independence or fear of a stigma surrounding program enrollment.
SNAP and WIC Usability. Ease of use could also increase utilization. WIC offered eWIC services in 2020 which facilitated electronic payment services to be used at participating supermarkets.71 Switching from checks to an electronic service card has allowed for more flexibility, convenience, and efficiency when buying groceries while also reducing the stigma some might associate with using the program.72
Local Efforts. Many of the programs listed later in this report also include efforts to make healthy foods more accessible to low-income populations.
For example, farmers markets, community supported agriculture programs, and community gardens support produce incentive programs and implement opportunities for lower-income Utahns to participate in these spaces. Further, local organizations are exploring how to reconnect local agriculture to school education, nutrition programs, and statewide commerce. And a wide variety of other organizations support people in accessing food and food resources. (See the appendix.) Finally, state and federal programs offer financing initiatives for small businesses to expand, redevelop, or renovate food retail to support healthy changes and alternatives in merchandising and advertising to benefit community development and promote healthy choices.
Produce Incentive Programs and Farmers Markets
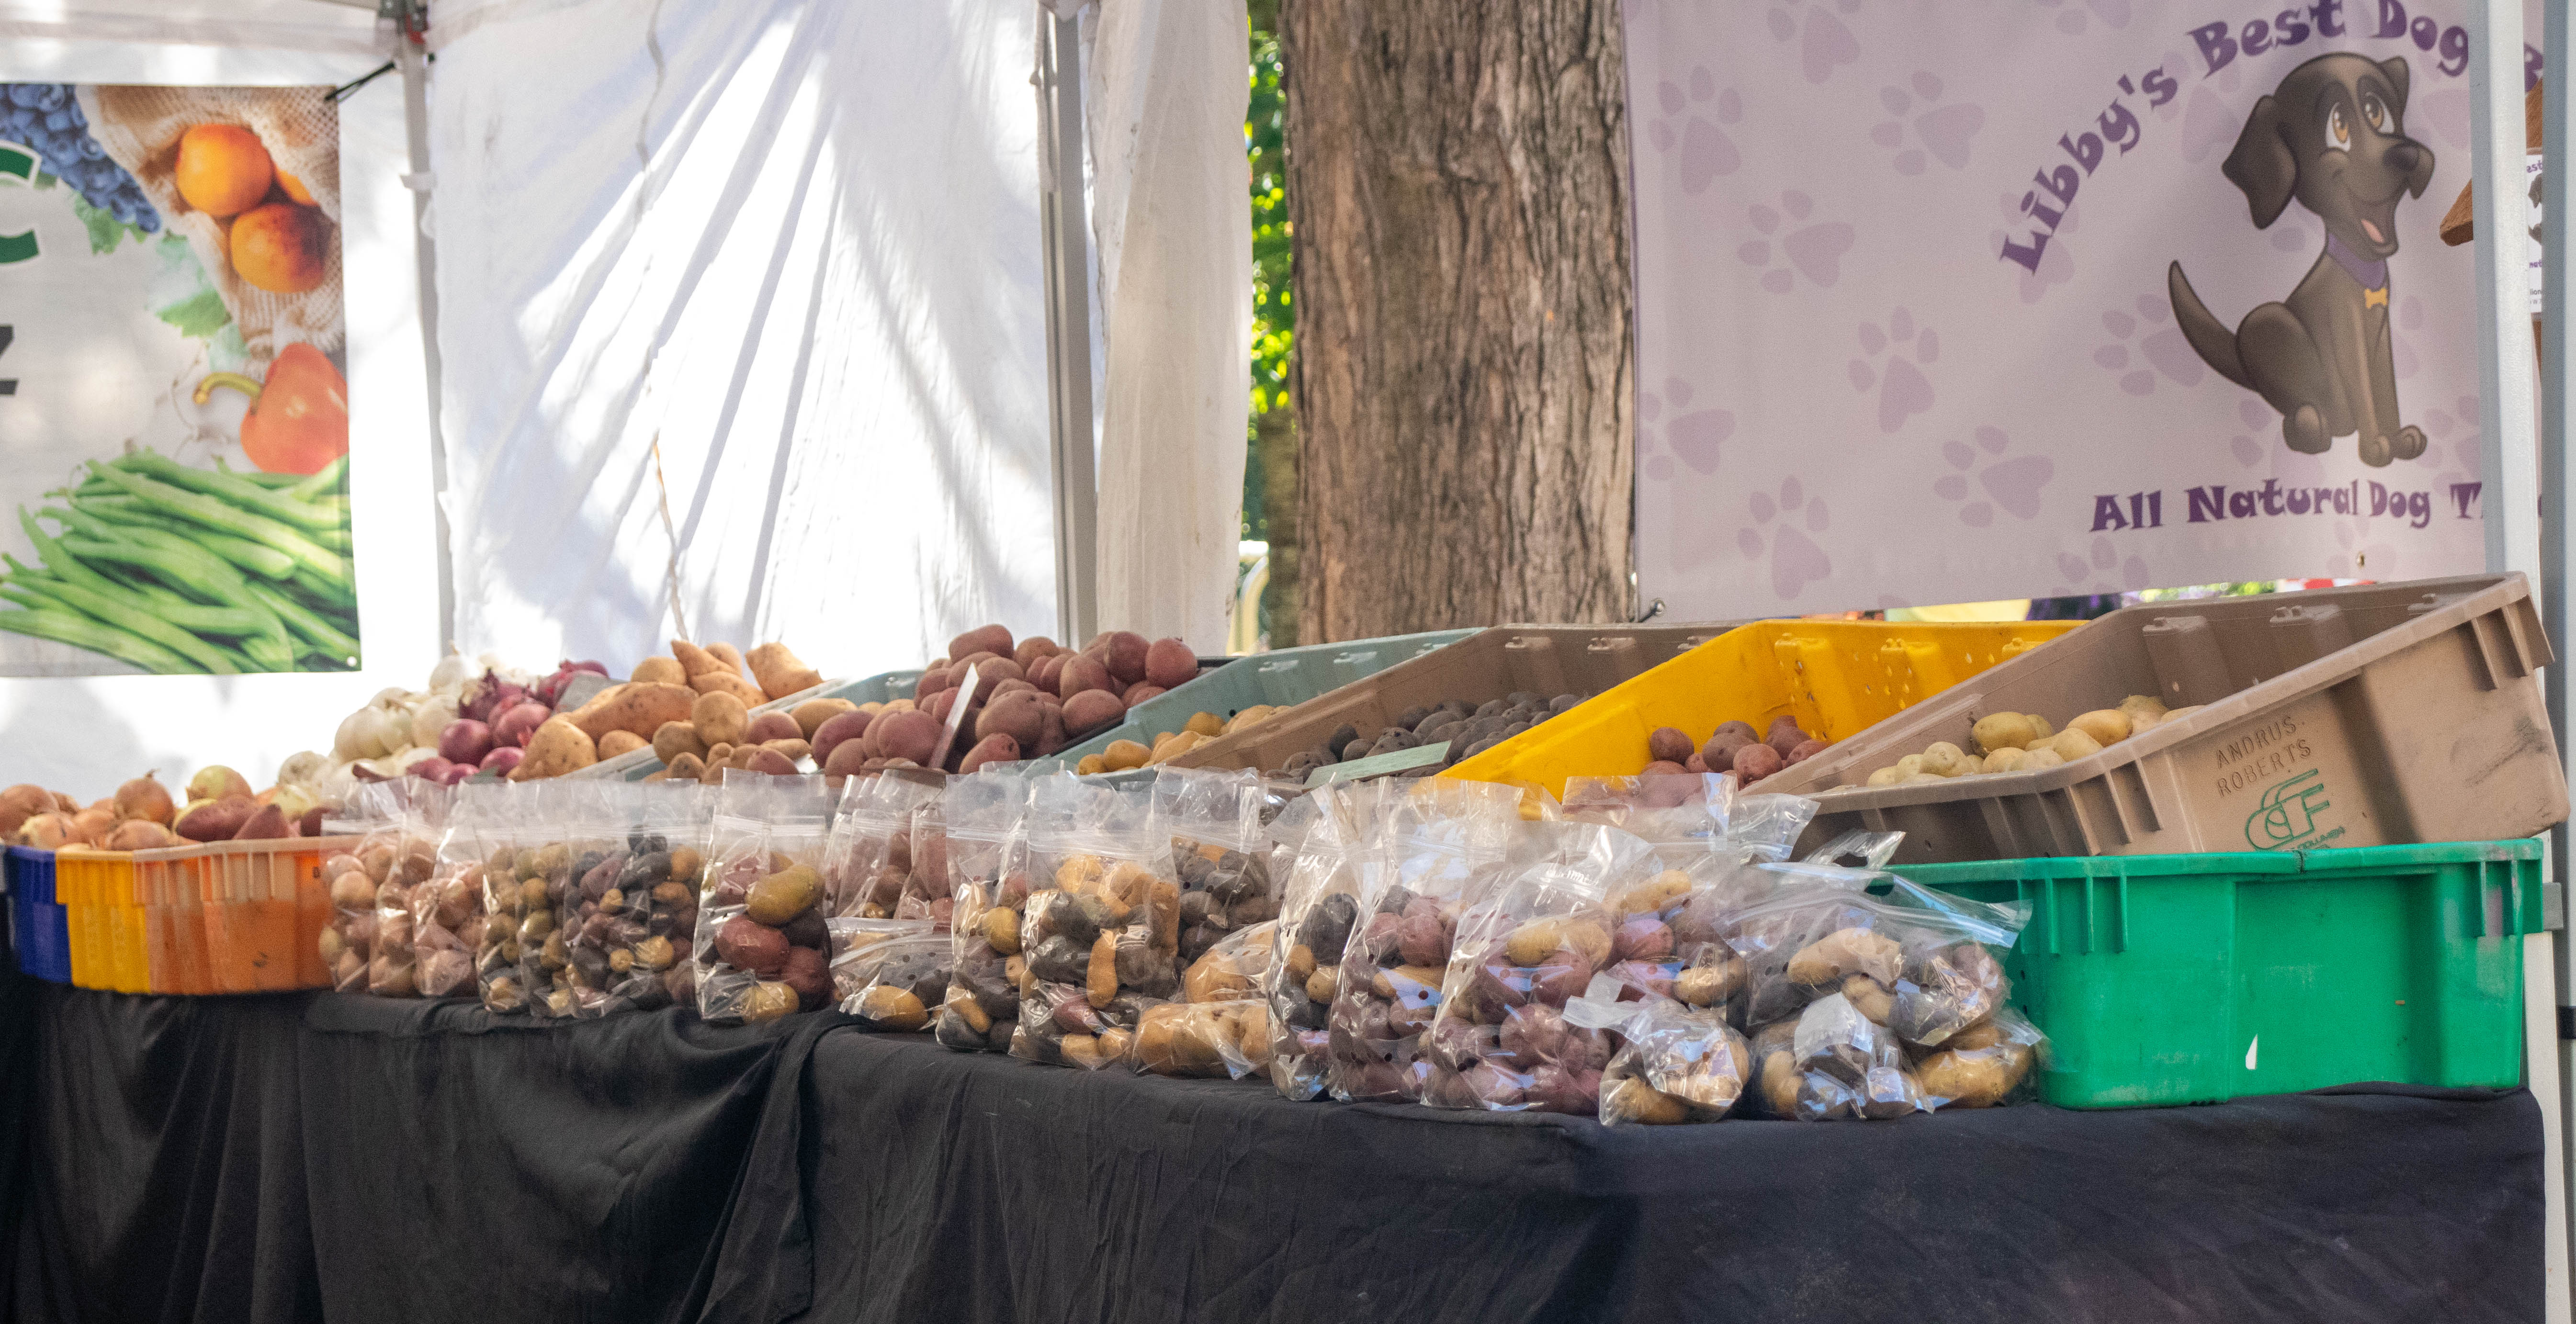
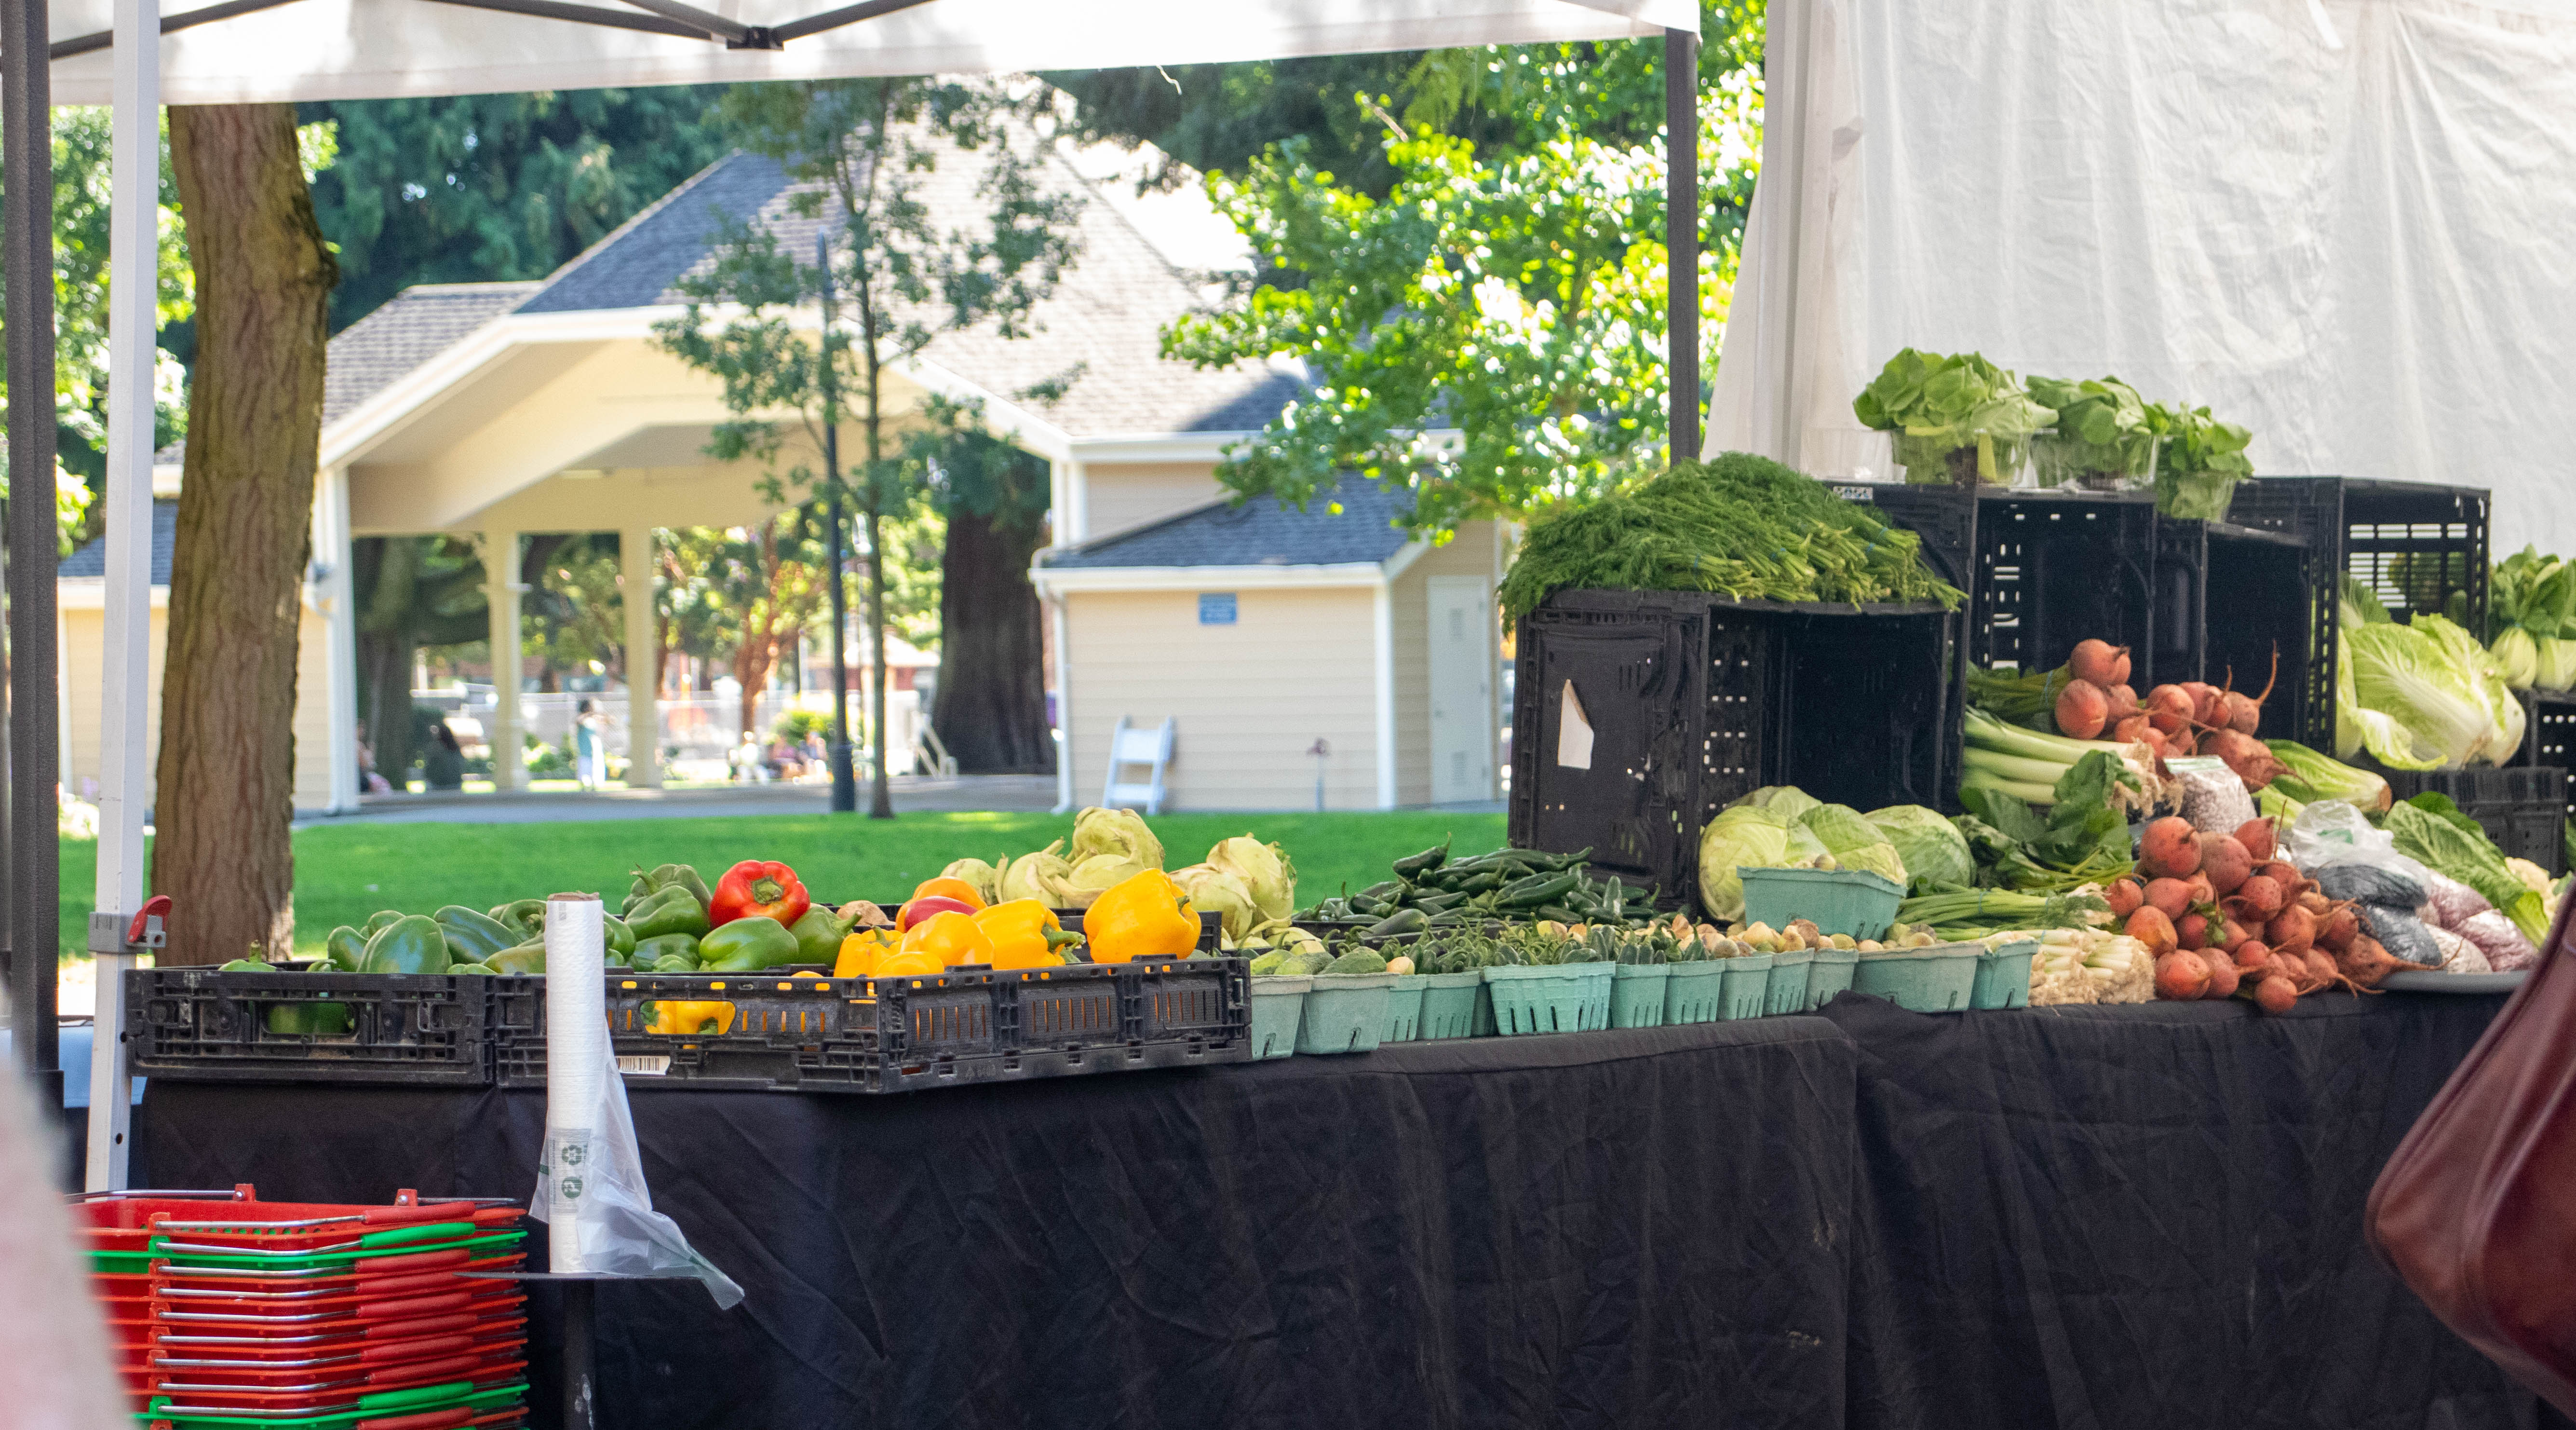
Local farmers markets are also a means by which to expand the number of locations where people can buy fresh produce while also serving to connect local agriculture and farms to the community. These markets increase accessibility the most when they are organized to serve an area without alternative sources of fresh fruit and vegetables nearby. Even then, the “special event” status of a farmer’s market can help draw in those who want to participate in a community event.
The use of Electronic Benefits Transfer terminals also allows farmers and markets to accept SNAP and WIC programs. The equipment required for these debit-card-type payment transfers can be expensive, but organizations like MarketLink (a USDA-funded program) help farmers and markets acquire this equipment at no cost.73
There are 20 farmers markets across the state that accept SNAP and participate in the Double Up Food Bucks program which offers a $1 for $1 match for people shopping with SNAP cards, capped at $30 per day. From 2015 to 2017, the program benefited 10,000 low-income Utahns as 80% of surveyed participants said they consumed more and a wider variety of fruits and vegetables thanks to Double Up.74
The Produce Rx is a fruit and vegetable voucher program implemented in a healthcare setting.75 Healthcare providers, including primary care providers, community health workers, and dietitians, screen and enroll eligible patients into the program during regular clinic visits. Produce Rx physicians can discuss nutrition and food access and provide food vouchers to be exchanged for fresh produce at farmers markets. These programs can also be leveraged with Double Up Food Bucks.76 The program serves to facilitate productive conversations about food security between patients and providers in a way that builds trust and understanding.
The Senior Farmers Market Nutrition Program offers $50 to low-income seniors to spend on fresh fruits, vegetables, honey, and herbs at participating farmers markets across the state.77 This program invests money into the local agriculture economy while simultaneously increasing the consumption of locally grown produce in an underserved population. Like Double Up, the Senior Farmers Market Nutrition Program increases healthy food access while supporting the local agriculture economy.
Community Supported Agriculture
Another way to localize access to fresh foods is through community supported agriculture programs (CSAs). These organizations are known traditionally for produce boxes, but some even sell grains, flour, maple syrup, meats, eggs, cheese, or other products.78 These allow people to purchase directly from farmers on a regular basis. The goal of CSAs is to connect people directly to local farms, to fresh local food, and to provide local farms with additional financial security through paid memberships. People purchase “shares” or “membership” in the organization which contracts with local farmers to ensure that enough food is grown every year to meet member demand.79
Participation in and increased access to CSAs is an effective way to address food insecurity and improve access to healthier direct market food outlets within food deserts.80 There are also CSA models for seniors to decrease the obstacles that limit their access to fresh and local foods and increase their participation in the local food and farm community.81 One simple approach is to offer delivery services. Further, there are a few CSAs that subsidize low-income senior memberships so that enrolled seniors will receive $50 boxes of produce throughout an eight-week season at no cost to them.82
The only issue with incremental payments rather than the up-front payment typical of CSAs is that it places a burden upon farms which are already low-margin businesses that typically require higher up-front costs. That said, policymakers and philanthropists could support “Food Equity” seed money or extra financing for CSAs and other food businesses focused on providing fresh foods to marginalized communities.83
Further, the federal Community Food Projects Competitive Grant Program provides grant dollars for projects that fight food insecurity and help promote the self-sufficiency of low-income communities.84 Food Project funds have supported food production projects including urban agriculture. Grants range from $25,000 to $400,000 for one to three years.85
|
Spotlight on new roots In Salt Lake County, New Roots operates three farmers markets. They employ skilled refugee and immigrant populations who assist farming and benefit food businesses by growing and then selling culturally important fruits and vegetables. Simultaneously, these populations are also becoming increasingly connected to the larger local community.86 New Roots offers two 18-week volunteer programs through which people can either assist staff in preparing CSA boxes or help local farmers manage their land. Program volunteers are effectively “paid” for their time with vegetables and the specialized skills they acquire.87 |
Food Hubs
A food hub is an organization that manages the aggregation, marketing, and distribution of food sourced from local producers.88 Not surprisingly, the pandemic and subsequent supply chain issues highlighted vulnerabilities in Utah’s food supply chain.89 Fortunately, food hubs are a way to decentralize the food supply chain and empower small to medium-sized farms to sell their produce in the wholesale market which would otherwise be out of their reach.90 Buyers benefit from food hubs by having a single contact from which to order food rather than contacting individual farms.
In Burlington, Vermont, the Intervale Food Hub connects 20 farmers to distribute their goods within the region. It is a year-round multi-farm CSA that accepts SNAP and allocates 1% of its profits to subsidize shares for low-income families and individuals.91 Similarly, the Corbin Hill Food Project, based out of Harlem, New York, has a mission to supply fresh food to those who need it most with a focus on low-income families and communities of color.92 They connect with 200 different growers throughout the Northeast and work with both farm share and community health partners to develop local programs and procurement practices that best meet the community’s needs. These examples show that various frameworks allow for food hubs to adapt to the needs of the community, combining farm shares and wholesale operations with local nonprofits, schools, and private institutions.
Unfortunately, Utah is one of the only states without a food-hub-style distribution center.93 Typically, food hubs that work with smaller farms focus on household consumers, and some run CSA programs. Those who sell to wholesalers typically work with larger farms. However, each food hub should be different as they represent different communities. There are hundreds of food hubs across the United States all with different models.94 Buyers for a food hub include hospitals, school districts, daycare centers, senior care facilities, restaurants, and many more local organizations.95
The Utah Local Food Advisory Council was established in 2017 to bring together various stakeholders who work towards solutions. This includes strengthening Utah’s food security, agriculture, food industries, and local economies.96 In 2021, the Council received a one-time appropriation from the USDA of $112,500 for the Local Food Hub Start Up and Development Fund. This will give one or more food entrepreneurs access to “seed” funding to use toward the development of a food hub that connects farm fresh food to consumers along the Wasatch Front.97
In 2022, the USDA signed a cooperative agreement with Utah under the Local Food Purchase Assistance Cooperative Agreement Program in which the Utah Health Department seeks to purchase and distribute locally grown, produced, and processed food from underserved producers.98 The goal and parameters of the program are to enable state, territory, and tribal governments to maintain or improve food and agricultural supply chain resiliency through the purchase of food produced within the state or 400 miles from the delivery destination. This is a major step in laying the groundwork for more permanent food hubs in Utah.
Connecting local growers with local processing could increase opportunities for economic growth and food security. It is recommended to have a minimum of 182,000 residents in a county for a food hub to break even.99 Given this basic criterion, Salt Lake, Weber, Davis, and Utah counties would be appropirate places to establish singular or cooperative food hubs. There are other factors such as social capital costs of a county and investment in other forms of local food ventures, like Utah’s Own, that increase the likely success of a food hub.100
Suburban, Urban, and Community Gardens
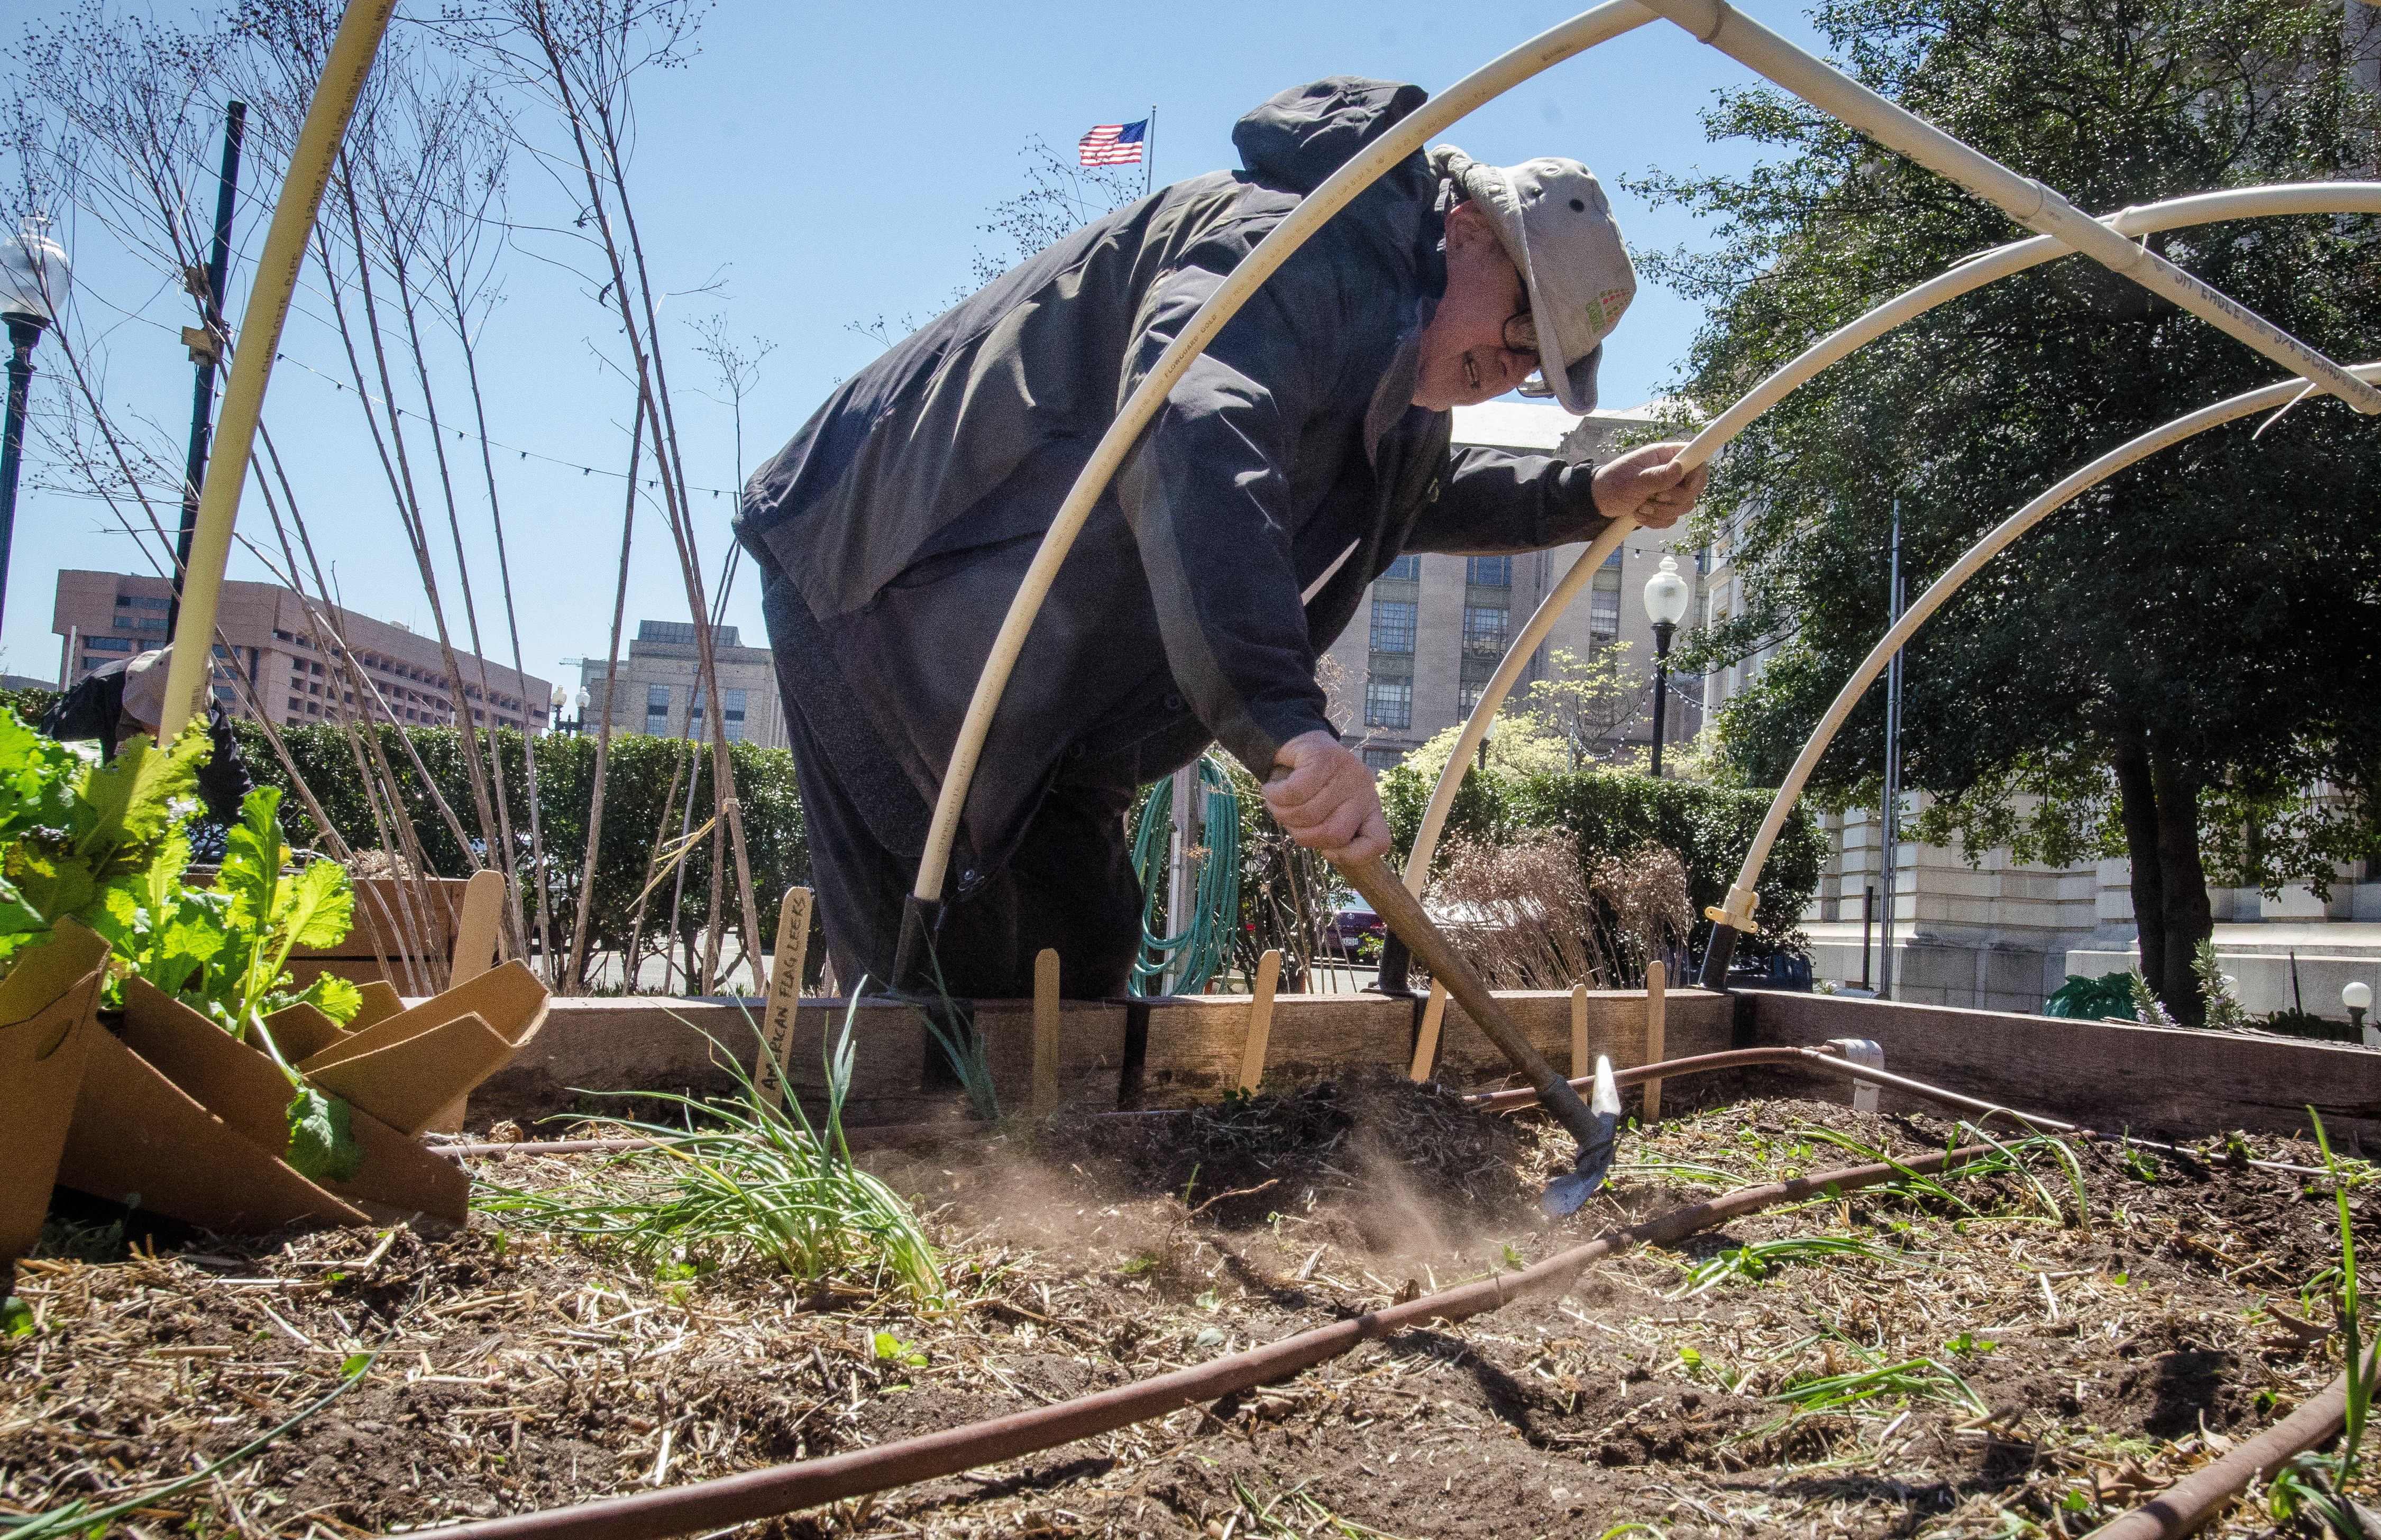
Urban gardening and community gardens can promote civic participation, public safety, food literacy, job skills, and urban greening in addition to providing a source of fresh fruits and vegetables.101 North Salt Lake and Vineyard run community garden programs. In addition, Wasatch Community Gardens, in partnership with Salt Lake City, manages 19 community gardens and is planning more.102 Wasatch Community Gardens also implements a “yard share” or “workshare” program that offers individuals the chance to share a plot on their own property with another person, creating community, and allowing the ability to grow one’s own produce and vegetables.103 These programs increase opportunities for people to learn about gardening and small-scale farming even if they do not have access to their own land.
Community Mapping
To the extent that food insecurity is a geographic problem, mapping to identify problem areas can increase the efficacy of any policy. As an example of such a mapping project, Seattle’s City Council passed Resolution 44 in 2008 supporting community gardens and urban agricultural development. The resolution called for the Department of Neighborhoods to identify land and locations for community gardens, food bank gardens, and community kitchens that would strengthen and maximize accessibility for all communities, especially for lower-income neighborhoods and residents of color. The Department partnered with the Seattle School District, the Seattle Public Utilities, Seattle City Light, and the Seattle Department of Parks and Recreation to propose a process and strategic plan for creating programs and policies to support urban agriculture.
|
Healthy Utah Communities The Utah Healthy Community Designation, created by Get Healthy Utah, encourages cities to meet requirements to promote healthier cities. Groups of program strategies include a community coalition, health equity, active living, access to healthy foods, and mental health. The most notable requirements include financial incentives for grocery stores to move into underserved communities, hosting farmers’ markets, creating active transportation plans, founding community gardens, and developing moderate-income housing plans. While there could be more aggressive measures taken, this framework is a great step toward engaging cities with the interconnected solutions needed to promote inclusive healthy cities and healthy living. |
Healthy Food Stores
The retail environment has a significant effect on the quality of food and the health of a community.104 Regardless of income level, households in areas with more nearby convenience stores often exhibit poorer diet quality than those living elsewhere.105 Further, several studies have shown that lower-income households are more likely than their higher-income counterparts to have convenience stores nearby, whereas the latter are generally nearer full-service supermarkets.106
Implementing “healthy corner store initiatives” increases the amount of healthy food and fruits and vegetables in food deserts while also encouraging small businesses.107 These initiatives focus upon neighborhoods with low access to full grocery stores and supermarkets to increase healthy food options within existing local convenience and corner stores. There are examples of these initiatives across the country fighting systemic food inequity in the most in-need neighborhoods of Denver, San Francisco, New York City, and Philadelphia.108 A study in Philadelphia saw participating stores experience increased profits and demand for healthy products while surrounding neighborhoods saw increased property values.109 Produce sales increased by 60% in stores studied, with 33% of all sales going to “healthy” items.110
There are challenges associated with starting healthy corner stores. Challenges include the cost of infrastructure changes, sourcing healthy food, quality assurance, proper refrigeration and preservation, knowledge, and perhaps costly competition with larger nearby grocery stores.111 However, community organizations can limit these risks and costs by encouraging the use of shelf space for fresh produce, by documenting unmet demand, by subsidizing extra costs, and by providing advice regarding where to buy and display produce. Further, small stores can buy produce from local farmers through a community supported agriculture program.112
Utah is home to many fast-food restaurants but relatively limited healthy food options.
Figure 4: Types and Number of Food Retailers in Utah, 2023
|
Food Retailers in Utah |
Count |
|
Community Service Agriculture |
31 |
|
Farmer’s Markets |
38 |
|
Cultural Specialty Grocery Stores |
91 |
|
Full-Service Supermarkets |
437 |
|
Convenience Food Stores |
500 |
|
Fast-food and Takeout Restaurants |
2,491 |
|
Total |
3,028 |
|
SNAP Retailers |
1,528 |
Sources: US Census Bureau: North American Industry Classification System, Utah Farmers Market Network, Wasatch Front Regional Council: Utah Grocery and Food Stores, US Census Bureau: County Business Patterns.
Some organizations provide grants and funds to support business transitions into healthy corner stores. The American Healthy Food Financing Initiative runs a small grant program that provides grants ranging from $20,000 to $200,000 (totaling $4 million in total grants annually) to assist with retail or enterprise development, renovation, or expansion.113 The grants are one-time investments of capital into a food retailer project to address higher costs and initial barriers to entry into underserved areas across the country. In addition, the Healthy Food Financing Initiative of the Department of the Treasury provides funds to assist businesses interested in expanding their healthy food financing activities. Grants help develop organizational sustainability and drive community revitalization.114 Small Business Retention Initiatives are also helpful as they are designed to support the development of small businesses – particularly in areas where the rising commercial rents and changing neighborhood demographics threaten these businesses with displacement.115 This kind of targeted assistance keeps vibrant communities intact and incentivizes more people to pursue small business operations.
As of September 2022, there are only four small corner stores in Utah implementing Healthy Corner Store practices.116
That said, Utah has a similar healthy corner store toolkit developed under the umbrella of Utah State University’s Create Better Health initiative. The initiative’s Thumbs Up Nudge program focuses on pantries and retail spaces. On the retail side, the program offers advice for store owners regarding how to make healthy changes to the corner store setting with many of the materials offered in Arabic, Spanish, French, Farsi, Somali, Dari, and soon Navajo and Ki Swahili.117
Healthy corner store initiatives can transform advertising, products, and placements.
Figure 5. Visual Example of a Shop Before and After Adopting the Healthy Corner Store Framework
Source: ChangeLabs Healthy Retail Playbook.
Food Waste Diversion
Another example of connecting people to food while also reducing food waste is through the practice of gleaning. Gleaning is simply the act of collecting excess fresh foods from farms, gardens, farmers markets, grocers, restaurants, state/county fairs, or any other sources to provide it to those in need. Gleaning organizations across North America cumulatively harvested 55 million pounds of produce in 2020. This practice reduces food waste that usually remains in the fields and increases community accessibility to fresh produce for low to no-income families.
Utah-based organizations like Waste Less Solutions and the Green Urban Lunch Box offer food rescue programs alongside food distribution outlets. Waste Less identifies food purveyors or companies who have excess quality food that would otherwise go to waste. Organization volunteers then pick up the food and return it to a partner organization to feed those in need.118 The Green Urban Lunch Box specializes in a FruitShare effort to partner with fruit tree owners and community volunteers to harvest fruit that would otherwise go to waste and distribute it to programs aimed at feeding low-income groups.119
Local Food Pantries
Emergency food services are essential as a frontline response to those facing hunger. Even in a post-pandemic landscape, most emergency food services reported that they have the capacity to serve the community’s current needs but would need to adjust the level of service if demand increased.120
However, at a 2021 stakeholder meeting and survey, three pantries in the Utah network reported that they were not able to meet the needs of the community and required more funding to increase and improve storage space, administration, capital equipment, and staffing to keep up with demand and expansion.121 Participating pantries emphasized the need and desire for more full-time employees, rather than the increased reliance upon volunteers, to focus on streamlining the food distribution process, reducing inefficiencies, and continuing to build relationships with community organizations and leaders for further collaboration.122
Many rural food pantries also face funding shortages making it difficult to keep food on their shelves.123 If a rural pantry closes, it could be detrimental to food security as it might be the only emergency food service in the area. However, in smaller rural communities, some people do not even bother seeking support at pantries or through other community services because they fear the social stigma tied to asking for help.124
It is important to note that due to the food-donation model, many of the foods offered at pantries are neither high in nutritional value nor culturally appropriate for many patrons. Often, food banks’ priorities first rest upon the quantity that they can provide before concerning the health of the food.
The Create Healthy Pantries initiative, a part of Utah State University’s Create Better Health, is tackling the issue of increasing the visibility and availability of nutritional foods in the state’s food pantries. As of September 2022, there are 30 food pantries in the state that are implementing the Create Healthy Pantries toolkit. Nearly three-quarters of food pantries working with SNAP-Ed increased shelf space, amount, or variety of healthy options as an adopted change.125
There are other Utah initiatives focused on connecting people to food resources and filling in gaps left by traditional food pantries around the state, such as the Utah Food Bank Mobile Pantry program. Many underserved communities rely heavily upon mobile food pantries to feed themselves and their families.
An online resource, FeedUT.org, is a tool that locates the closest food pantry, the closest free ready-to-eat meals for individuals and seniors, and the closest farmers markets that accept SNAP using a person’s geolocation or address.126
The FoodFinder phone app is another technologically savvy resource to reduce the hassle and time spent finding a food service to serve an individual’s or family’s needs.127
|
Indirect Food Support Food insecurity is often a symptom of economic instability. Addressing the causes of instability could help increase food security for households around the state. Options could include:
Transportation and mobility can also play a role. Transit often increases food accessibility in quantitative terms while affordable transit options can also help make good food relatively more affordable.129 Similarly, zoning and land use plans can be used by cities to shape neighborhoods and combat food insecurity through transportation planning, allowing agricultural designation within the city ordinances, or embracing a health-in-all-policies approach to zoning.130 Zoning codes can both promote and prohibit certain businesses or uses depending on what the city needs. For example, South Los Angeles placed a moratorium on permits for stand-alone fast-food restaurants in certain neighborhoods because the community did not see these kinds of establishments as benefiting the health of the people they were serving.131 Municipalities can also decide how land can be used and how increasing said uses can allow for space dedicated to food such as community gardens, urban community-supported agriculture, farmers markets, and full-service grocery stores. Cities and towns can inventory public and private land, authorize leasing agreements with private landowners, clear contaminated land, and authorize the use of municipal land. This has been done successfully on various levels in Seattle, Chicago, Cleveland, Austin, Hartford, and Washington D.C. |
CONCLUSION
Food is an essential part of life and culture. As such, the question of having enough food can too often cause people severe anxiety. Numerous entities across Utah are therefore attempting to address food insecurity in several ways.
For example, schools provide an excellent setting to help ensure the food stability of children. This can include meal assistance, pantries, and nutrition programs. Further, food waste diversion programs and local food pantries can help the broader community.
For lower-income Utahns, streamlining enrollment in federally funded food-stability programs can help increase their efficacy. This is especially true for older Utahns who are relatively under-enrolled in these program.
Farmers markets organized in areas not otherwise served by grocery stores can also increases access to healthy foods. Community supported agriculture programs and community gardens can similarly do so.
Notably, convenience and corner stores are more widely scattered across many geographies relative to full-service grocery stores. Many of these small stores already accept SNAP and WIC funds, but empowering them to provide healthier options for local consumers can greatly increase food accessibility, nutrition, and health.
Finally, while many food programs are in use across the state, Utah is one of few states without a food hub. These hubs can help manage the aggregation, marketing, and distribution of food sourced from local producers to the broader population and those in need.
Nearly all of the efforts included in this report will be enhanced if used in conjunction with community mapping to target areas with low food availability. Ultimately, state and local governments, community groups, and residents have many tools available to improve food security and access to healthy food options. The question is to determine which mix of policies might be the most effective and efficient, and to decide how far Utahns will go to remedy these issues.
Appendix: Local Community Resources and Programs
America’s Healthy Food Financing Initiative through the Reinvestment Fund. Information about eligibility, and funding opportunities to improve access to healthy food options in underserved communities: https://www.investinginfood.com/
CSA Utah. A directory of Utah’s CSAs to connect consumers to local farmers and growers offering purchase shares: https://csautah.org/find-a-csa
Create Better Health Nutrition Courses. Resource for SNAP recipients to take courses and gain knowledge in nutrition, eating healthy on a budget and tasty recipes: https://extension.usu.edu/createbetterhealth/
Double Up Food Bucks (DUFB). To find market locations that accept DUFB near you please visit this link.
Eat Well Utah Toolkit. A resource by the Utah Department of Health and Human Services statewide initiative to make healthy food choices more available and appealing wherever food is served or sold: https://heal.utah.gov/eat-well-utah/
FeedUT. A tool to help people find the closest food pantry to their location as well as ready to eat meals, farmers markets accepting SNAP and benefit office locations: https://feedut.org/
Food Research and Action Center (FRAC) Utah. Improves the nutrition, health, and well-being of people struggling against poverty-related hunger in the United States through advocacy, partnerships, and by advancing bold and equitable policy solutions: https://frac.org
Free Fridges. A Salt Lake City mutual aid subsidiary project which maintains a few fridges placed throughout the city stocked with fresh and prepared food items by donors and free to take for all, 24/7:
- Green Urban Lunch Box Free Fridge Instagram: @gulb.fridge 3188 S 1100 W
- Sugarhouse Free Fridge Instagram: @sugarhouse.fridge 720 E Loveland Ave
- Rose Park Free Fridge Instagram: @rosepark.fridge 1151 N 1500 W
National Breakfast School Program (NSBP) in Utah. Resource for schools looking to enroll or keep funding for NBSP: https://www.schools.utah.gov/cnp/nsbp?mid=1204&tid=0 New Roots. A subsidiary of the International Rescue Committee focused on supporting immigrants and increasing community food access through markets, workshares, and CSAs: https://newrootsslc.org/
Start Smart. Utah State Board of Education resource for schools and school districts looking to implement school breakfast programs: https://startsmartutah.org/starting-your-program
TOP (Teaching Obesity Prevention) Star. Endorsement for child-care facilities that create opportunities for children to learn about healthy habits, to actively play together both indoors and out, and to engage in less screen time: https://heal.utah.gov/childcare/
Utah 211. An over the phone or online resource network for people to find local health and social services, including food assistance. Dial 211 or access https://www.211.org/
Utah Farm to Fork. Farm to School movement to improve farm education and connections communities have with local agriculture: https://www.utfarmtofork.org/
Utah Farmers Markets Network. A directory of Utah’s farmers markets by region and season: https://www.utahfarmersmarketnetwork.org/find-a-farmers-market
Utah Transit Authority Reduced Fare Passes. Qualifying youth, seniors, people with disabilities, and low-income residents can apply for a discounted UTA pass: https://www.rideuta.com/Fares-And-Passes/Reduced-Fare
Wasatch Community Gardens. Information about the community gardens, workshares, educational and job training programs offered across Utah: https://wasatchgardens.org/
1 Senate Bill 141, 2021 General Session, “Task force on food security,” https://le.utah.gov/~2021/bills/sbillenr/SB0141.pdf.
2 Feeding America, 2022, “What is food insecurity,” Feeding America, https://www.feedingamerica.org/hunger-in-america/food-insecurity.
3 U.S. Department of Agriculture Economic Research Service, 2023, “Measurement,” U.S. Department of Agriculture, https://www.ers.usda.gov/topics/food-nutrition-assistance/food-security-in-the-u-s/measurement/#insecurity.
4 U.S. Department of Agriculture Economic Research Service, 2023, “State fact sheets: Utah,” U.S. Department of Agriculture, https://data.ers.usda.gov/reports.aspx?StateFIPS=49&StateName=Utah&ID=17854.
5 Ibid.
6 Utah Food Security Task Force, 2021 “Report to the Utah State Legislature: Food Security Task Force,” https://www.utah.gov/pmn/files/775519.pdf; Coleman-Jensen, Alisha, Matthew P. Rabbit, Christian A. Gregory, Anita Singh, 2023, “Household food security in the United States in 2022,” U.S. Department of Agriculture Economic Research Service, https://www.ers.usda.gov/webdocs/publications/104656/err-309.pdf?v=8702.6.
7 Coleman-Jensen, Alisha, Matthew P. Rabbit, Christian A. Gregory, Anita Singh, 2023, “Household food security in the United States in 2022,” U.S. Department of Agriculture Economic Research Service, https://www.ers.usda.gov/webdocs/publications/104656/err-309.pdf?v=8702.6.
8 Utah Food Security Council, 2023, “Utah hunger statistics,” Utah State University Extension, https://extension.usu.edu/hsi/fsc-utah-hunger-statistics.
9 Utah Food Bank, 2022, “Expanding to better serve our indigenous neighbors,” Utah Food Bank, https://www.utahfoodbank.org/2022/11/01/expanding-to-better-serve-our-indigenous-neighbors/.
10 Coleman-Jensen, Alisha, Matthew P. Rabbit, Christian A. Gregory, Anita Singh, 2023, “Household food security in the United States in 2022,” U.S. Department of Agriculture Economic Research Service, https://www.ers.usda.gov/webdocs/publications/104656/err-309.pdf?v=8702.6.
11 Rhone, Alana, Ryan Williams, and Christopher Dicken, 2022, “Low-income and low-foodstore access census tracts, 2015–19,” EIB-236, U.S. Department of Agriculture, Economic Research Service, https://www.ers.usda.gov/webdocs/publications/104158/eib-236.pdf?v=8722.5.
12 Munson, Kristen, 2016, “Living in a food desert in the desert,” Utah Public Radio, https://www.upr.org/news/2016-06-07/living-in-a-food-desert-in-the-desert.
13 Suarez Jonathan J., et al, 2015, “Food access, chronic kidney disease, and hypertension in the US,” American Journal of Preventive Medicine, 2015;49:912–920, https://doi.org/10.1016/j.amepre.2015.07.017.
14 Reinvestment Fund, 2023, “Report on Utah,” Policy Map, https://www.policymap.com/report_widget?type=hfap&area=predefined&pid=545711&pr=1&sid=1395; Munson, Kristen, 2016, “Living in a food desert in the desert,” Utah Public Radio, https://www.upr.org/news/2016-06-07/living-in-a-food-desert-in-the-desert.
15 U.S. Department of Agriculture and U.S. Department of Health and Human Services, 2020, “Dietary guidelines for Americans, 2020-2025,” https://www.dietaryguidelines.gov/sites/default/files/2021-03/Dietary_Guidelines_for_Americans-2020-2025.pdf.
16 Centers for Disease Control and Prevention, National Center for Chronic Disease Prevention and Health Promotion, Division of Nutrition, Physical Activity, and Obesity, 2023, “Nutrition, physical activity and obesity Data, trends and maps,” Centers for Disease Control and Prevention, National Center for Chronic Disease Prevention and Health Promotion, Division of Nutrition, Physical Activity, and Obesity, https://nccd.cdc.gov/dnpao_dtm/rdPage.aspx?rdReport=DNPAO_DTM.ExploreByLocation&rdRequestForwarding=Form. Navigate to the table by selecting the following options: Utah, Fruits and Vegetables, Fruits and Vegetables – Behavior, 2021.
17 Ibid.
18 Hammer, Heather C. et al, 2023, “Fruit, vegetable and sugar-sweetened beverage intake among young children, by state – United States, 2021” Morbidity and Mortality Weekly Report, https://www.cdc.gov/mmwr/volumes/72/wr/mm7207a1.htm.
19 Centers for Disease Control and Prevention, 2022, “Facts about sugar-sweetened beverages and consumption,” Centers for Disease Control and Prevention, https://www.cdc.gov/nutrition/data-statistics/sugar-sweetened-beverages-intake.html.
20 Centers for Disease Control and Prevention, National Center for Chronic Disease Prevention and Health Promotion, Division of Nutrition, Physical Activity, and Obesity, 2023, “Poor nutrition,” Centers for Disease Control and Prevention, National Center for Chronic Disease Prevention and Health Promotion, Division of Nutrition, Physical Activity, and Obesity, https://www.cdc.gov/chronicdisease/resources/publications/factsheets/nutrition.htm; Kelli, Heval M., et al, 2017, “Association Between living in food deserts and cardiovascular risk,” Circulation: Cardiovascular Quality and Outcomes, Sep; 10(9), https://pubmed.ncbi.nlm.nih.gov/28904075/.
21 Centers for Disease Control and Prevention, National Center for Chronic Disease Prevention and Health Promotion, Division of Nutrition, Physical Activity, and Obesity, 2023, “Health and economic costs of chronic diseases,” Centers for Disease Control and Prevention, National Center for Chronic Disease Prevention and Health Promotion, Division of Nutrition, Physical Activity, and Obesity, https://www.cdc.gov/chronicdisease/about/costs/index.htm.
22 Dall, Timothy M. et al., 2019, “The economic burden of elevated blood glucose levels in 2017”, Diabetes Care, September 2019, vol. 42, https://www.ncbi.nlm.nih.gov/pmc/articles/PMC6702607/.
23 Trogdon, Justin .G., Eric A. Finkelstein, Charles W. Feagan, and Joel W Cohen, 2012, “State- and payer-specific estimates of annual medical expenditures attributable to obesity,” Obesity, 20: 214-220. https://doi.org/10.1038/oby.2011.169.
24 Valerie Tarasuk et al., 2015 “Association between household food insecurity and annual health care costs,” Canadian Medical Association Journal, 187(14):E429-E436, http://www.cmaj.ca/content/187/14/E429; Seth A. Berkowitz, Sanjay Basu, James B. Meigs, and Hillary K. Seligman, 2018, “Food Insecurity and Health Care Expenditures In the United States, 2011-2013, Health Services Research, Jun; 53(3):1600-1620 https://pubmed.ncbi.nlm.nih.gov/28608473/
25 Suarez Jonathan J., et al, 2015, “Food access, chronic kidney disease, and hypertension in the US,” American Journal of Preventive Medicine, 2015;49:912–920, https://doi.org/10.1016/j.amepre.2015.07.017.
26 Senate Bill 141, 2021 General Session, “Task force on food security,” https://le.utah.gov/~2021/bills/static/SB0141.html.
27 Utah Food Security Task Force, 2021 “Report to the Utah State Legislature: Food Security Task Force,” https://www.utah.gov/pmn/files/775519.pdf.
28 Senate Bill 133, 2022 General Session, “Food security amendments,” https://le.utah.gov/~2022/bills/static/SB0133.html.
29 Reese, Julene, 2023, “New Utah Food Security Council based at USU,” Utah Farm Bureau, https://www.utahfarmbureau.org/Article/New-Utah-Food-Security-Council-Based-at-USU.
30 Utah Food Security Task Force, 2021 “Report to the Utah State Legislature: Food Security Task Force,” https://www.utah.gov/pmn/files/775519.pdf.
31 Food Research & Action Center, 2016, “Research brief: Breakfast for learning,” Food Action & Research Center, https://frac.org/wp-content/uploads/breakfastforlearning-1.pdf.
32 Fox Mary Kay, et al, 2019, “School nutrition and meal cost study, final report volume 4: Student participation, satisfaction, plate waste, and dietary intakes,” U.S. Department of Agriculture, Food and Nutrition Service, Office of Policy Support, https://fns-prod.azureedge.us/sites/default/files/resource-files/SNMCS-Volume4.pdf; Gearan, Elizabeth C. and Mary Kay Fox. 2020, “Updated nutrition standards have significantly improved the nutritional quality of school lunches and breakfasts.” Journal of the Academy of Nutrition and Dietetics, https://doi.org/10.1016/j.jand.2019.10.022.
33 Kinderknecht Kelsey, Cristen Harris, and Jessica Jones-Smith. 2020, “Association of the Healthy, Hunger-Free Kids Act with dietary quality among children in the US National School Lunch Program,” Journal of the American Medical Association, 2020;324(4):359-368 https://doi.org/10.1001/jama.2020.9517; Fox Mary Kay, et al, 2019, “School nutrition and meal cost study, final report volume 4: Student participation, satisfaction, plate waste, and dietary intakes,” U.S. Department of Agriculture, Food and Nutrition Service, Office of Policy Support, https://fns-prod.azureedge.us/sites/default/files/resource-files/SNMCS-Volume4.pdf.
34 Centers for Disease Control and Prevention 2018, “Vital signs: Progress on childhood obesity,” https://archive.cdc.gov/www_cdc_gov/vitalsigns/childhoodobesity/index.html.
35 Hayes, Clarissa and Crystal FitzSimons, 2022, “The reach of breakfast and lunch: A look at pandemic and pre-pandemic participation,” Food Research & Action Center, https://frac.org/wp-content/uploads/SchoolMealsReport2022.pdf.
36 Hayes, Clarissa and Crystal FitzSimons, 2021, “School breakfast scorecard: School year 2019-2020,” Food Research & Action Center, https://frac.org/wp-content/uploads/FRAC_BreakfastScorecard_2021.pdf; Woolford, Marti, 2017, “Starting the day right II: Best practices for increasing school breakfast participation in Utah schools,” Utah Breakfast Expansion Team, https://www.uah.org/images/Starting_the_Day_Right_2018.pdf.
37 Utah Food Security Task Force, 2021 “Report to the Utah State Legislature: Food Security Task Force,” https://www.utah.gov/pmn/files/775519.pdf.
38 Economou, Robbie, 2022, “States step in as end of free school meal waivers looms,” National Conference of State Legislatures, https://www.ncsl.org/state-legislatures-news/details/states-step-in-as-end-of-free-school-meal-waivers-looms.
39 House Bill 222, 2020 General Session, “Start Smart Utah Breakfast Program,” https://le.utah.gov/~2020/bills/static/HB0222.html.
40 Economou, Robbie, 2022, “States step in as end of free school meal waivers looms,” National Conference of State Legislatures, https://www.ncsl.org/state-legislatures-news/details/states-step-in-as-end-of-free-school-meal-waivers-looms.
41 U.S. Department of Agriculture Food and Nutrition Service, “Community eligibility provision,” U.S. Department of Agriculture Food and Nutrition Service, https://www.fns.usda.gov/cn/community-eligibility-provision.
42 Food Research & Action Center, 2023, “Community Eligibility Data,” Food Research & Action Center, https://frac.org/community-eligibility-database/.
43 USBE & Morgan Hadden with Get Healthy Utah. See https://docs.google.com/document/d/17kzOP8zTj2L4v2zR5Z_Eh55_b6hJqI88mN62rnJNGpU/edit; U.S. Department of Agriculture Food and Nutrition Service, 2023, “Proposed rule: Child nutrition programs Community Eligibility Provision – Increasing options for schools,” U.S. Department of Agriculture Food and Nutrition Service, https://www.fns.usda.gov/cn/fr-032323.
44 Spurance, Lori A. et al., 2023, “Healthy school meals for all in Utah,” Journal of School Health, https://doi.org/10.1111/josh.13412.
45 Nonparticipants consumed 60% more calories, 60% more saturated fat, 61% more sodium, double the amount of sugar, and half the amount of fruit See Spurance, Lori A. et al., 2023, “Healthy school meals for all in Utah,” Journal of School Health, https://doi.org/10.1111/josh.13412.
46 Get Healthy Utah, 2022, “Healthy School Pantries: Tips and resources for Utah’s schools,” https://drive.google.com/file/d/10Y3dYnfiwe99W7wVhWApGl8seHrAu5Gm/view or https://archive.org/details/get_healthy_utah-2022-toolkit_for_healthy_school_pantries.
47 Ibid.
48 Utah Food Bank, 2019, “Kids Cafe,” Utah Food Bank, https://www.utahfoodbank.org/programs/kids-cafe/.
49 Get Healthy Utah, 2022, “Healthy School Pantries: Tips and resources for Utah’s schools,” https://drive.google.com/file/d/10Y3dYnfiwe99W7wVhWApGl8seHrAu5Gm/view or https://archive.org/details/get_healthy_utah-2022-toolkit_for_healthy_school_pantries.
50 Ibid.
51 Farm to Fork, 2023 “Farm to Fork strategic plan,” Farm to Fork, https://www.utfarmtofork.org/_files/ugd/1cbc9a_fb8accf7b3c349a3bd2a0780d0b180c5.pdf.
52 U.S. Department of Agriculture Economic Research Service, 2023, “Food & nutrition assistance,” U.S. Department of Agriculture Economic Research Service, https://www.ers.usda.gov/topics/food-nutrition-assistance/.
53 U.S. Department of Agriculture Food and Nutrition Service, 2019, “Supplemental Nutrition Assistance Program (SNAP),” U.S. Department of Agriculture Food and Nutrition Service, https://www.fns.usda.gov/snap/supplemental-nutrition-assistance-program.
54 Benefits.gov, 2021, “Learn the difference between SNAP and WIC programs,” https://www.benefits.gov/news/article/439.
55 U.S. Department of Agriculture Economic Research Service, 2023, “Frequently asked questions (FAQs),” U.S. Department of Agriculture Economic Research Service, https://www.fns.usda.gov/wic/frequently-asked-questions.
56 Wheaton, Laura and Victoria Tran, 2018, “The antipoverty effects of the Supplemental Nutrition Assistance Program,” Urban Institute, https://www.urban.org/sites/default/files/publication/96521/the_antipoverty_effects_of_the_supplemental_nutrition_assistance_program_4.pdf.
57 Food Research & Action Center, 2019, “WIC is a critical economic, nutrition, and health support for children and families,” Food Research & Action Center, https://frac.org/wp-content/uploads/frac_brief_wic_critical_economic_nutrition_health_support.pdf.
58 Wheaton, Laura and Victoria Tran, 2018, “The antipoverty effects of the Supplemental Nutrition Assistance Program,” Urban Institute, https://www.urban.org/sites/default/files/publication/96521/the_antipoverty_effects_of_the_supplemental_nutrition_assistance_program_4.pdf; Food Research & Action Center, 2018, “Rural hunger in America: Special supplemental nutrition program for women, infants and children,” Food Research & Action Center, https://frac.org/wp-content/uploads/wic-in-rural-communities.pdf
59 Food Research & Action Center, 2017, “The positive effect of SNAP benefits on participants and communities,” Food Research & Action Center, https://frac.org/programs/supplemental-nutrition-assistance-program-snap/positive-effect-snap-benefits-participants-communities.
60 Ibid.
61 Carlson, Steven and Brynne Keith-Jennings, 2018, “Snap is linked with improved nutritional outcomes and lower health care costs,” Center on Budget and Policy Priorities, https://www.cbpp.org/research/food-assistance/snap-is-linked-with-improved-nutritional-outcomes-and-lower-health-care.
62 Ibid.
63 Cornia, Gina, 2022, “Rural food insecurity brief,” Utahns Against Hunger, https://drive.google.com/file/d/110ZHAEHAADWeFdczei4xxqWK2_R6Ffxz/view or https://archive.org/details/rural-utah-food-insecurity-brief.
64 Utahns Against Hunger, 2020, “SNAP outreach,” Utahns Against Hunger, https://www.uah.org/our-work/snap-outreach.
65 uAspire, 2021, “Support for enhanced access to SNAP (EATS) Act of 2021 (HR 1919, S 2515) and or the Student Food Security Act (HR 3100, S 1569) (6).” uAspire, Accessible on Archive.org at https://web.archive.org/web/20230324070219/https://www.uaspire.org/BlankSite/media/uaspire/Support-for-Enhanced-Access-To-SNAP-(EATS)-Act-of-2021-(H-R-1919,-S-2515)-and-or-the-Student-Food-Security-Act-(H-R-3100,-S-1569)-(6).pdf.
66 County Health Rankings, 2020, “Fruit & vegetable incentive programs,” County Health Rankings, https://www.countyhealthrankings.org/take-action-to-improve-health/what-works-for-health/strategies/fruit-vegetable-incentive-programs.
67 Food Research & Action Center, 2016, “U.S. hunger solutions: Best practices for creating a federally reimbursable SNAP outreach plan,” Food Research & Action Center, https://frac.org/wp-content/uploads/best-practice-creating-federally-reimbursable-snap-outreach-plan.pdf.
68 Utah State University Extension, 2020, “Create better health,” Utah State University Extension, https://extension.usu.edu/createbetterhealth//.
69 America’s Health Rankings, “America’s Health Rankings analysis of U.S. Department of Agriculture, characteristics of Supplemental Nutrition Assistance Program Households,” America’s Health Rankings, https://www.americashealthrankings.org/explore/senior/measure/SNAP_Reach/state/UT.
70 Lampkin, Cheryl, L. 2022, “Focus on food insecurity: SNAP experiences and under-enrollment among the 50-plus,” AARP Research, https://www.aarp.org/pri/topics/health/food-insecurity/food-security-snap-knowledge-attitudes-experiences.html.
71 Utahns Against Hunger, 2023, “WIC program,” Utahns Against Hunger, https://www.uah.org/get-help/wic-program.
72 Moselle, Aaron, 2019, “Safety net program for Pa. women and children is switching out paper for plastic,” WHYY, https://whyy.org/articles/safety-net-program-for-pa-women-and-children-is-switching-out-paper-for-plastic/; Lee, Tara, 2019, “New food benefit debit cards work to reduce stigma and improve efficiency,” Washington State, https://www.governor.wa.gov/news-media/new-food-benefit-debit-cards-work-reduce-stigma-and-improve-efficiency.
73 County Health Rankings, 2023, “Electronic benefit transfer payment at farmers markets,” County Health Rankings, https://www.countyhealthrankings.org/take-action-to-improve-health/what-works-for-health/strategies/electronic-benefit-transfer-payment-at-farmers-markets.
74 Utahns Against Hunger, 2018, “Double up food bucks” Utahns Against Hunger, https://drive.google.com/file/d/1EkSrBcuwDozoVU6N5M4NDQ4HVQ1c10Lt/view or https://archive.org/details/utahns_against_hunger-2021-double_up_food_bucks.
75 Marion County Public Health Department, “Produce prescription (RX) program,” Marion County Public Health Department, https://freshbucksindy.org/produce-rx/.
76 Utahns Against Hunger, 2018, “Utah produce incentives: 2018 local food advisory council report,” Utahns Against Hunger, https://uah.org/images/pdfs-doc/LFAC%20appropriation/UT%20Produce%20Incentives_2019%20Legislative%20Session%20Final.pdf.
77 U.S. Department of Agriculture Food and Nutrition Service, 2023, “Seniors farmers market nutrition program,” U.S. Department of Agriculture Food and Nutrition Service, https://www.fns.usda.gov/sfmnp/fact-sheet-2021.
78 DeMuth, Suzanne, 1993, “An EXCERPT from Community Supported Agriculture (CSA): An Annotated Bibliography and Resource Guide,” U.S. Department of Agriculture, Agricultural Research Service, https://search.nal.usda.gov/discovery/delivery/01NAL_INST:MAIN/12285165180007426.
79 Ibid.
80 Flournoy, Rebecca, and Sarah Treuhaft, 2010, “Healthy food, healthy communities: Promising strategies to improve access to healthy food and transform communities” PolicyLink, 18 https://www.policylink.org/sites/default/files/HEALTHYFOOD.pdf; Prial, Daniel, 2019 “Community Supported Agriculture” ATTRA Sustainable Agriculture – National Center for Appropriate Technology, https://attradev.ncat.org/wp-content/uploads/2022/06/community-supported-agriculture.pdf.
81 Local Food Research Center, 2013, “CSAs as a strategy to increase food access: Models of success,” Appalachian Sustainable Agriculture Project, https://asapconnections.org/downloads/csas-as-a-strategy-to-increase-food-access.pdf/.
82 Ibid.
83 Salt Lake City, 2023, “Salt Lake City announces food equity microgrant awardees,” Salt Lake City, https://www.slc.gov/blog/2023/08/15/salt-lake-city-announces-food-equity-microgrant-awardees/.
84 U.S. Department of Agriculture National Institute of Food and Agriculture, 2023, “Request for applications: Community food projects competitive grant program,” U.S. Department of Agriculture National Institute of Food and Agriculture, https://www.nifa.usda.gov/sites/default/files/2023-10/FY24-CFP-RFA-508-MOD1-P.pdf.
85 Ibid.
86 New Roots SLC, 2021 “Farmer’s Markets,” International Rescue Committee, https://newrootsslc.org/farmers-markets.
87 Ibid.
88 Meter, Ken, 2021, “How feasible is a food hub for northern Utah? A report prepared for the City of Salt Lake,” Crossroads Resource Center, https://www.crcworks.org/utnorth21.pdf.
89 Simonsen, Shannon, et al, 2022, “Economic report to the Governor,” Utah Economic Council, https://gardner.utah.edu/wp-content/uploads/ERG2022-Full.pdf.
90 Utah Stories, 2022, “Why Salt Lake City needs a food hub,” Utah Stories, https://www.youtube.com/watch?v=k4iUpkLxklY.
91 Healthy Food Access, 2020, “Food hubs”, Healthy Food Access, https://www.healthyfoodaccess.org/launch-a-business-models-food-hubs.
92 Corbin Hill Food Project, 2020 “Mission,” Corbin Hill Food Project, https://corbinhill-foodproject.org/mission.
93 Hargraves, Caroline, 2021, “Food hubs: Expanding markets for farm-fresh goods region-wide,” Utah Department of Agriculture and Food, https://ag.utah.gov/newsletters/food-hubs-expanding-markets-for-farm-fresh-goods-region-wide/.
94 U.S. Department of Agriculture Agricultural Marketing Service, 2022, “Local food directories,” U.S. Department of Agriculture Agricultural Marketing Service, https://www.ams.usda.gov/services/local-regional/food-directories.
95 Utahns Against Hunger, 2019, “Local food hub startup and development fund: ($250,000 one-time),” Utahns Against Hunger, https://www.uah.org/images/pdfs-doc/LFAC%20appropriation/final%20-%202019%20Food%20Hub%20Startup%20(1).pdf.
96 Utah Department of Agriculture and Food, 2023, “Local food advisory council,” Utah Department of Agriculture and Food, https://ag.utah.gov/local-food-advisory-council/.
97 Utah Department of Agriculture and Food, 2021, “FY2022 Local Food Hub Startup and Development Fund,” Utah Department of Agriculture and Food, https://ag.utah.gov/foodhubgrant/.
98 U.S. Department of Agriculture Agricultural Marketing Service, 2022, “USDA announces Its Local Food Purchase Assistance Cooperative Agreement with Utah,“ U.S. Department of Agriculture Agricultural Marketing Service, https://www.ams.usda.gov/press-release/usda-announces-its-local-food-purchase-assistance-cooperative-agreement-utah.
99 Devlin, Kristen, 2019, “Location, location, location: Where and how do good hubs flourish?” Penn State University, https://www.psu.edu/news/research/story/location-location-location-where-and-how-do-food-hubs-flourish/.
100 Ibid.
101 Winig, Ben and Heather Wooten, 2020, “Dig, eat, and be healthy: A guide to growing food on public property,” ChangeLab Solutions, https://www.changelabsolutions.org/sites/default/files/Dig_Eat_and_Be_Happy_FINAL_20130610_0.pdf.
102 Salt Lake City, 2022 “Community Gardens,” Salt Lake City, https://www.slc.gov/sustainability/local-food/community-gardens/.
103 Wasatch Community Gardens, 2023 “Utah Yard Share,” Wasatch Community Gardens,” https://wasatchgardens.org/community-gardens/utah-yard-share.
104 Holaday, Rio, et al, 2016, “Healthy retail playbook,” ChangeLab Solutions, https://www.changelabsolutions.org/sites/default/files/Healthy_Retail_PLAYBOOK_FINAL_20160622.pdf.
105 Rummo, Pasquale E., et al, 2015, “Neighborhood availability of convenience stores and diet quality: Findings from 20 years of follow-up in the Coronary Artery Risk Development in Young Adults study,” American Journal of Public Health, 2015;105:e65–e73, https://doi.org/10.2105/AJPH.2014.302435.
106 Peng, Ke and Nikhil Kaza, 2020, “Association between neighborhood food access, household income, and purchase of snacks and beverages in the United States, International Journal of Environmental Research and Public Health, https://doi.org/10.3390%2Fijerph17207517.
107 County Health Rankings, 2023, “Healthy food in convenience stores,” County Health Rankings, https://www.countyhealthrankings.org/take-action-to-improve-health/what-works-for-health/strategies/healthy-food-in-convenience-stores.
108 Scanlon, Scott, 2022, “‘Everybody’s loving this:’ Healthy corner store initiative grows in East Buffalo,” Buffalo News, https://buffalonews.com/news/local/everybodys-loving-this-healthy-corner-store-initiative-grows-in-east-buffalo/article_2f6d0210-18fe-11ed-a7a4-434befe38c3e.html; Tenderloin Neighborhood Development Corporation, 2020, “TNDC Healthy Corner Store Coalition,” Tenderloin Neighborhood Development Corporation, https://www.tndc.org/our-work/voice/community-organizing/healthy-cornerstores; New York City Department of Health and Mental Hygiene, 2013, “Shop healthy NYC! How to adopt a shop: A guide to working with your local food retailer,” New York City Department of Health and Mental Hygiene, https://www.nyc.gov/assets/doh/downloads/pdf/pan/adopt-a-shop-guide.pdf.
109 The Food Trust, 2013, “Healthy Corner Store Initiative,” The Food Trust, https://thefoodtrust.org/wp-content/uploads/2022/07/healthy-corner-store-overview.original.pdf.
110 Sustainable Consumption Urban Sustainability Directors Network, 2021 “Healthy Corner Store Alternatives,” https://sustainableconsumption.usdn.org/initiatives-list/healthy-corner-store-alternatives.
111 Holaday, Rio, et al, 2016, “Healthy retail playbook,” ChangeLab Solutions, https://www.changelabsolutions.org/sites/default/files/Healthy_Retail_PLAYBOOK_FINAL_20160622.pdf.
112 Healthy Food Access, 2020 “Corner Stores,” Healthy Food Access, https://www.healthyfoodaccess.org/launch-a-business-models-corner-stores.
113 America’s Healthy Food Financing Initiative, 2023, “Grant Opportunities,” Reinvestment Fund, accessible via Internet Archive: https://web.archive.org/web/20230701055819/https://www.investinginfood.com/grant-opportunities/.
114 U.S. Department of the Treasury Community Development Financial Institutions Fund, “CDFI Program,” U.S. Department of the Treasury Community Development Financial Institutions Fund, https://www.cdfifund.gov/programs-training/programs/cdfi-program.
115 UC Berkeley Urban Displacement Project, “Gentrification, displacement and the role of public investment: A literature review,” March 3, 2015, UC Berkeley Institute of Urban & Regional Development, http://iurd.berkeley.edu/uploads/Displacement_Lit_Review_Final.pdf.
116 LeBlanc, Heidi, LaCee Jimenez and Casey Coombs, 2022, “Create better health Utah annual report: Year 3,” Utah State University Extension, https://extension.usu.edu/fscreate/files/2023-25-staff/2022-CBH-Annual-Report.pdf.
117 Utah State University Extension, 2022, “Healthy Choices simple swap posters,” Utah State University Extension, https://extension.usu.edu/fscreate/healthy-choices-simple-swap-posters.
118 Waste Less Solutions, 2021, “What is food rescue,” Waste Less Solutions, https://www.wastelesssolutions.org/what-we-do/what-is-food-rescue.
119 The Green Urban Lunchbox, 2020, “FruitShare,”The Green Urban Lunchbox, https://thegreenurbanlunchbox.com/programs/fruitshare/.
120 Utahns Against Hunger, 2021, “Emergency Food Assistance Fund report,” Utahn’s Against Hunger, https://drive.google.com/file/d/1uGrlcwne7l5pxXy4TfTi3Iztm4SWsYBO/view or https://archive.org/details/utahns_against_hunger-2021-emergency_food_assistance_fund_report.
121 Ibid.
122 Ibid.
123 Beal-Cvetko, Bridger, 2022, “Food pantries face record demand. Why relief is nowhere in sight,” Deseret News, https://www.deseret.com/utah/2022/5/12/23058834/food-pantries-cost-of-living-inflation-gas-grocery-prices-economy-recession-covid-pandemic.
124 Cornia, Gina, 2022, “Rural food insecurity brief,” Utahns Against Hunger, https://drive.google.com/file/d/110ZHAEHAADWeFdczei4xxqWK2_R6Ffxz/view or https://archive.org/details/rural-utah-food-insecurity-brief.
125 LeBlanc, Heidi, LaCee Jimenez and Casey Coombs, 2022, “Create better health Utah annual report: Year 3,” Utah State University Extension, https://extension.usu.edu/fscreate/files/2023-25-staff/2022-CBH-Annual-Report.pdf.
126 Feed UT, 2020, “Feed UT,” AQUEHS Corp, https://feedut.org/.
127 Foodfinder Inc, 2023 “Find food pantries near you: Quick & accurate locator,” Foodfinder Inc, https://foodfinder.us/.
128 Shafer, Paul R., Katherine M. Gutierrez, and Stephanie Ettinger de Cuba, 2022, “Association of the implementation of Child Tax Credit advance payment with food insufficiency in US households,” Journal of the American Medical Association Network Open, 2022;5(1), https://jamanetwork.com/journals/jamanetworkopen/fullarticle/2788110.
129 National Center for Mobility Management, 2020, “Access to Healthy Food,” National Center for Mobility Management, https://nationalcenterformobilitymanagement.org/access-to-healthy-food-choices/; Public Health Alliance of Southern California, 2022, “Healthy Places Index policy guides,” Public Health Alliance of Southern California, https://policies.healthyplacesindex.org/decision-support/public-transit-access/policies#free-or-discounted-passes-for-transit; Burrows, Kimberly, 2019, “How stable, affordable housing can help tackle food insecurity,” Urban Institute, https://housingmatters.urban.org/articles/how-stable-affordable-housing-can-help-tackle-food-insecurity.
130 Change Lab Solutions, 2020, “Health in All Policies,” Change Lab Solutions, https://www.changelabsolutions.org/health-all-policies; Utah Foundation, 2023, Healthy Communities: Advancing Wellness and Safety, Utah Foundation, https://www.utahfoundation.org/reports/healthy-communities-advancing-wellness-and-safety/.
131 Centers for Disease Control and Prevention, National Center for Chronic Disease Prevention and Health Promotion, Division of Nutrition, Physical Activity, and Obesity, 2014, “Food access through land use planning and policies,” CDC NCCDPHP, https://www.cdc.gov/nccdphp/dnpao/health-equity/health-equity-guide/pdf/health-equity-guide/Health-Equity-Guide-sect-3-4.pdf.


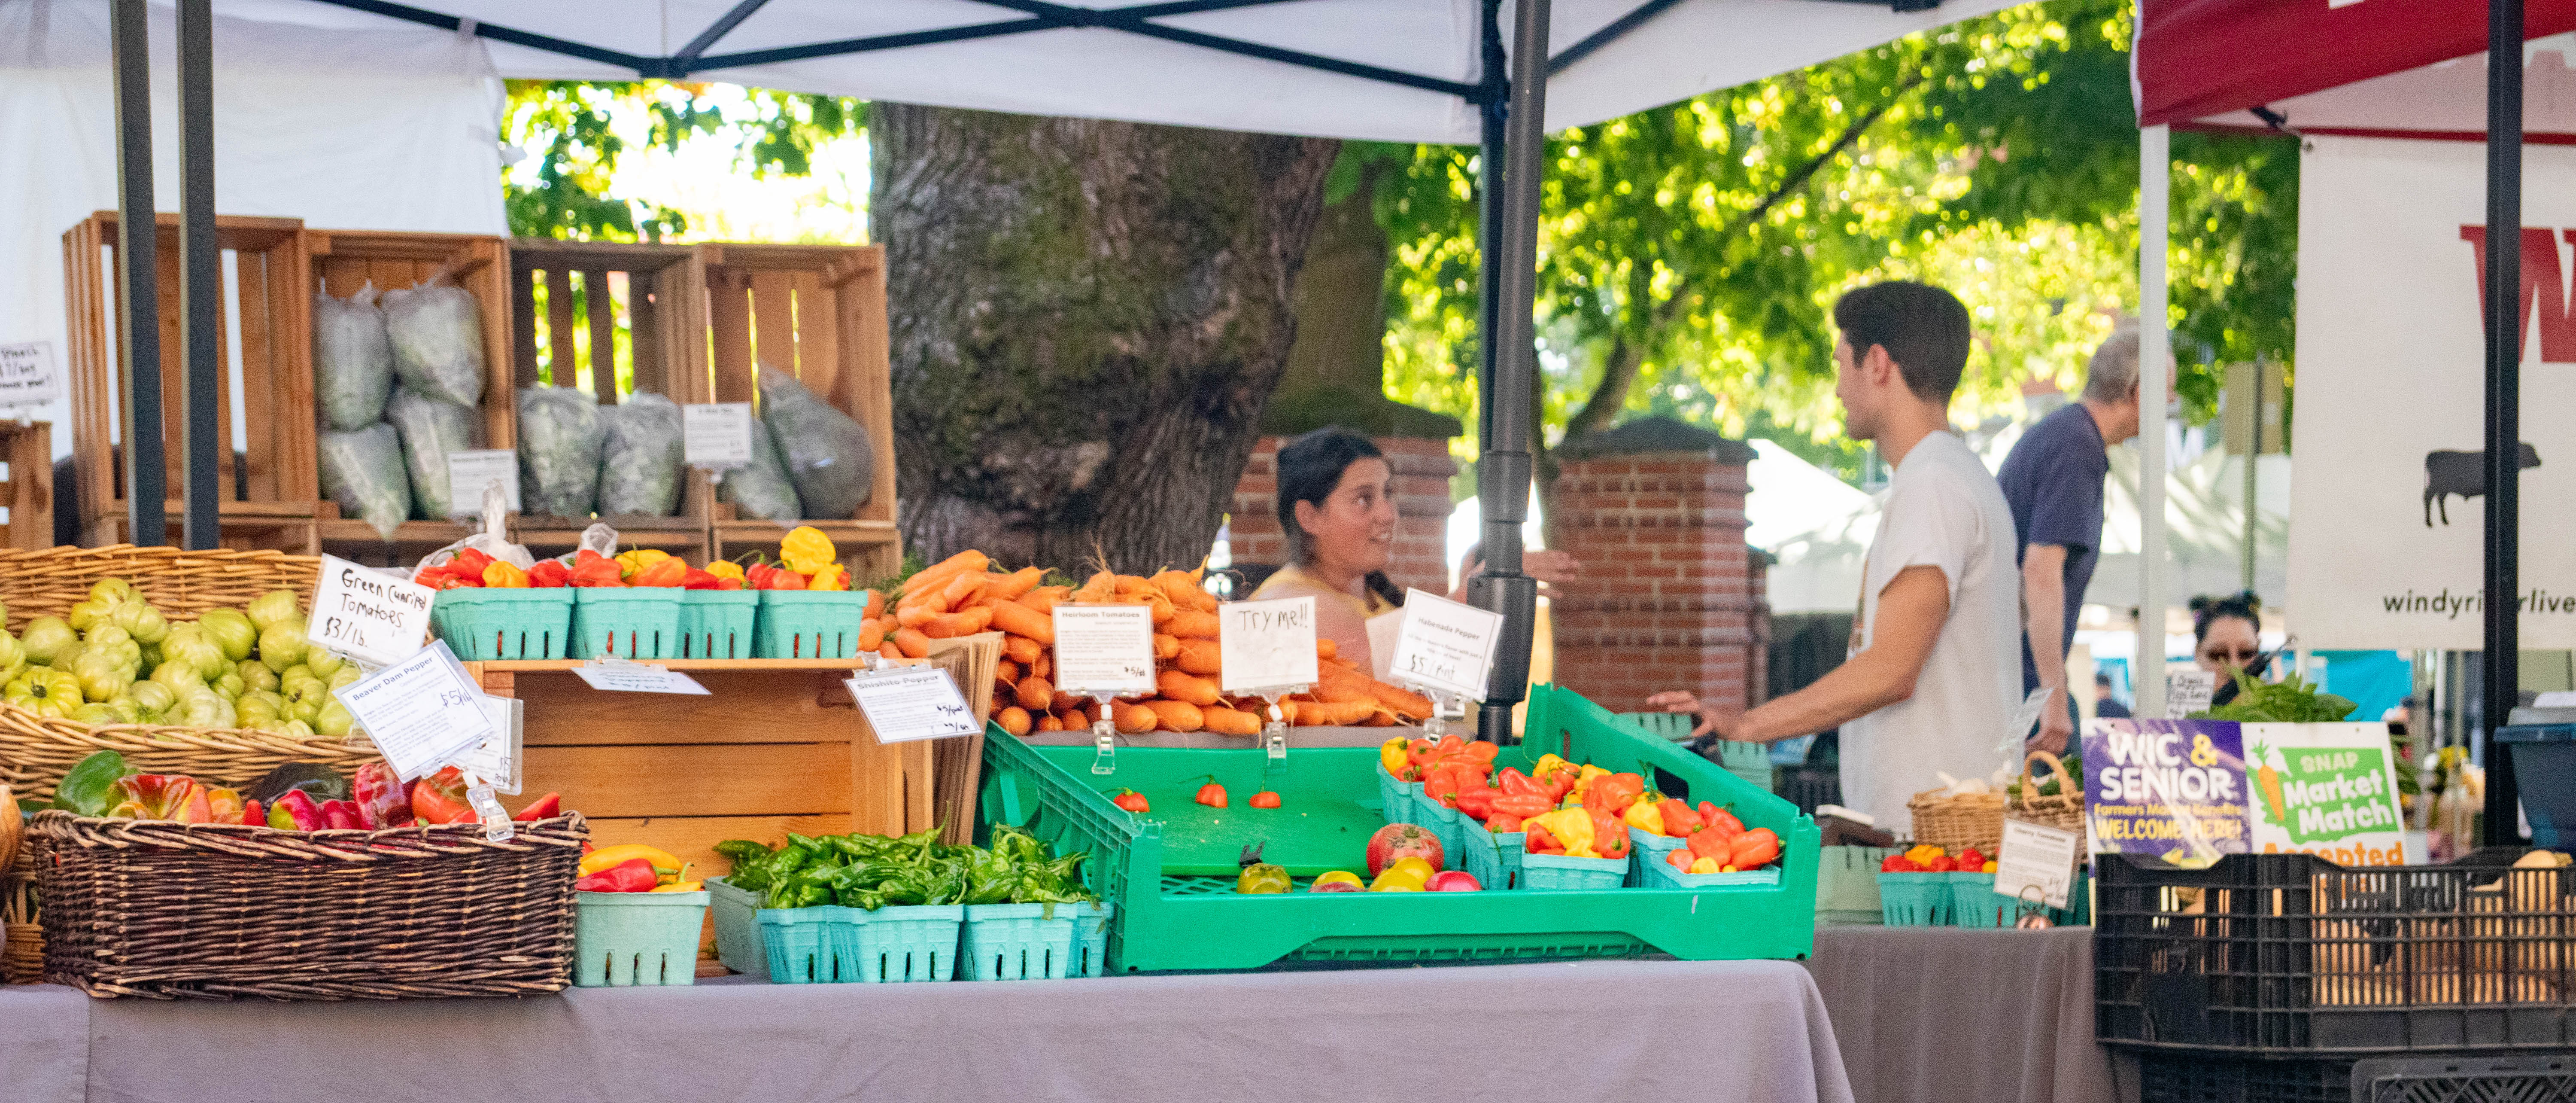
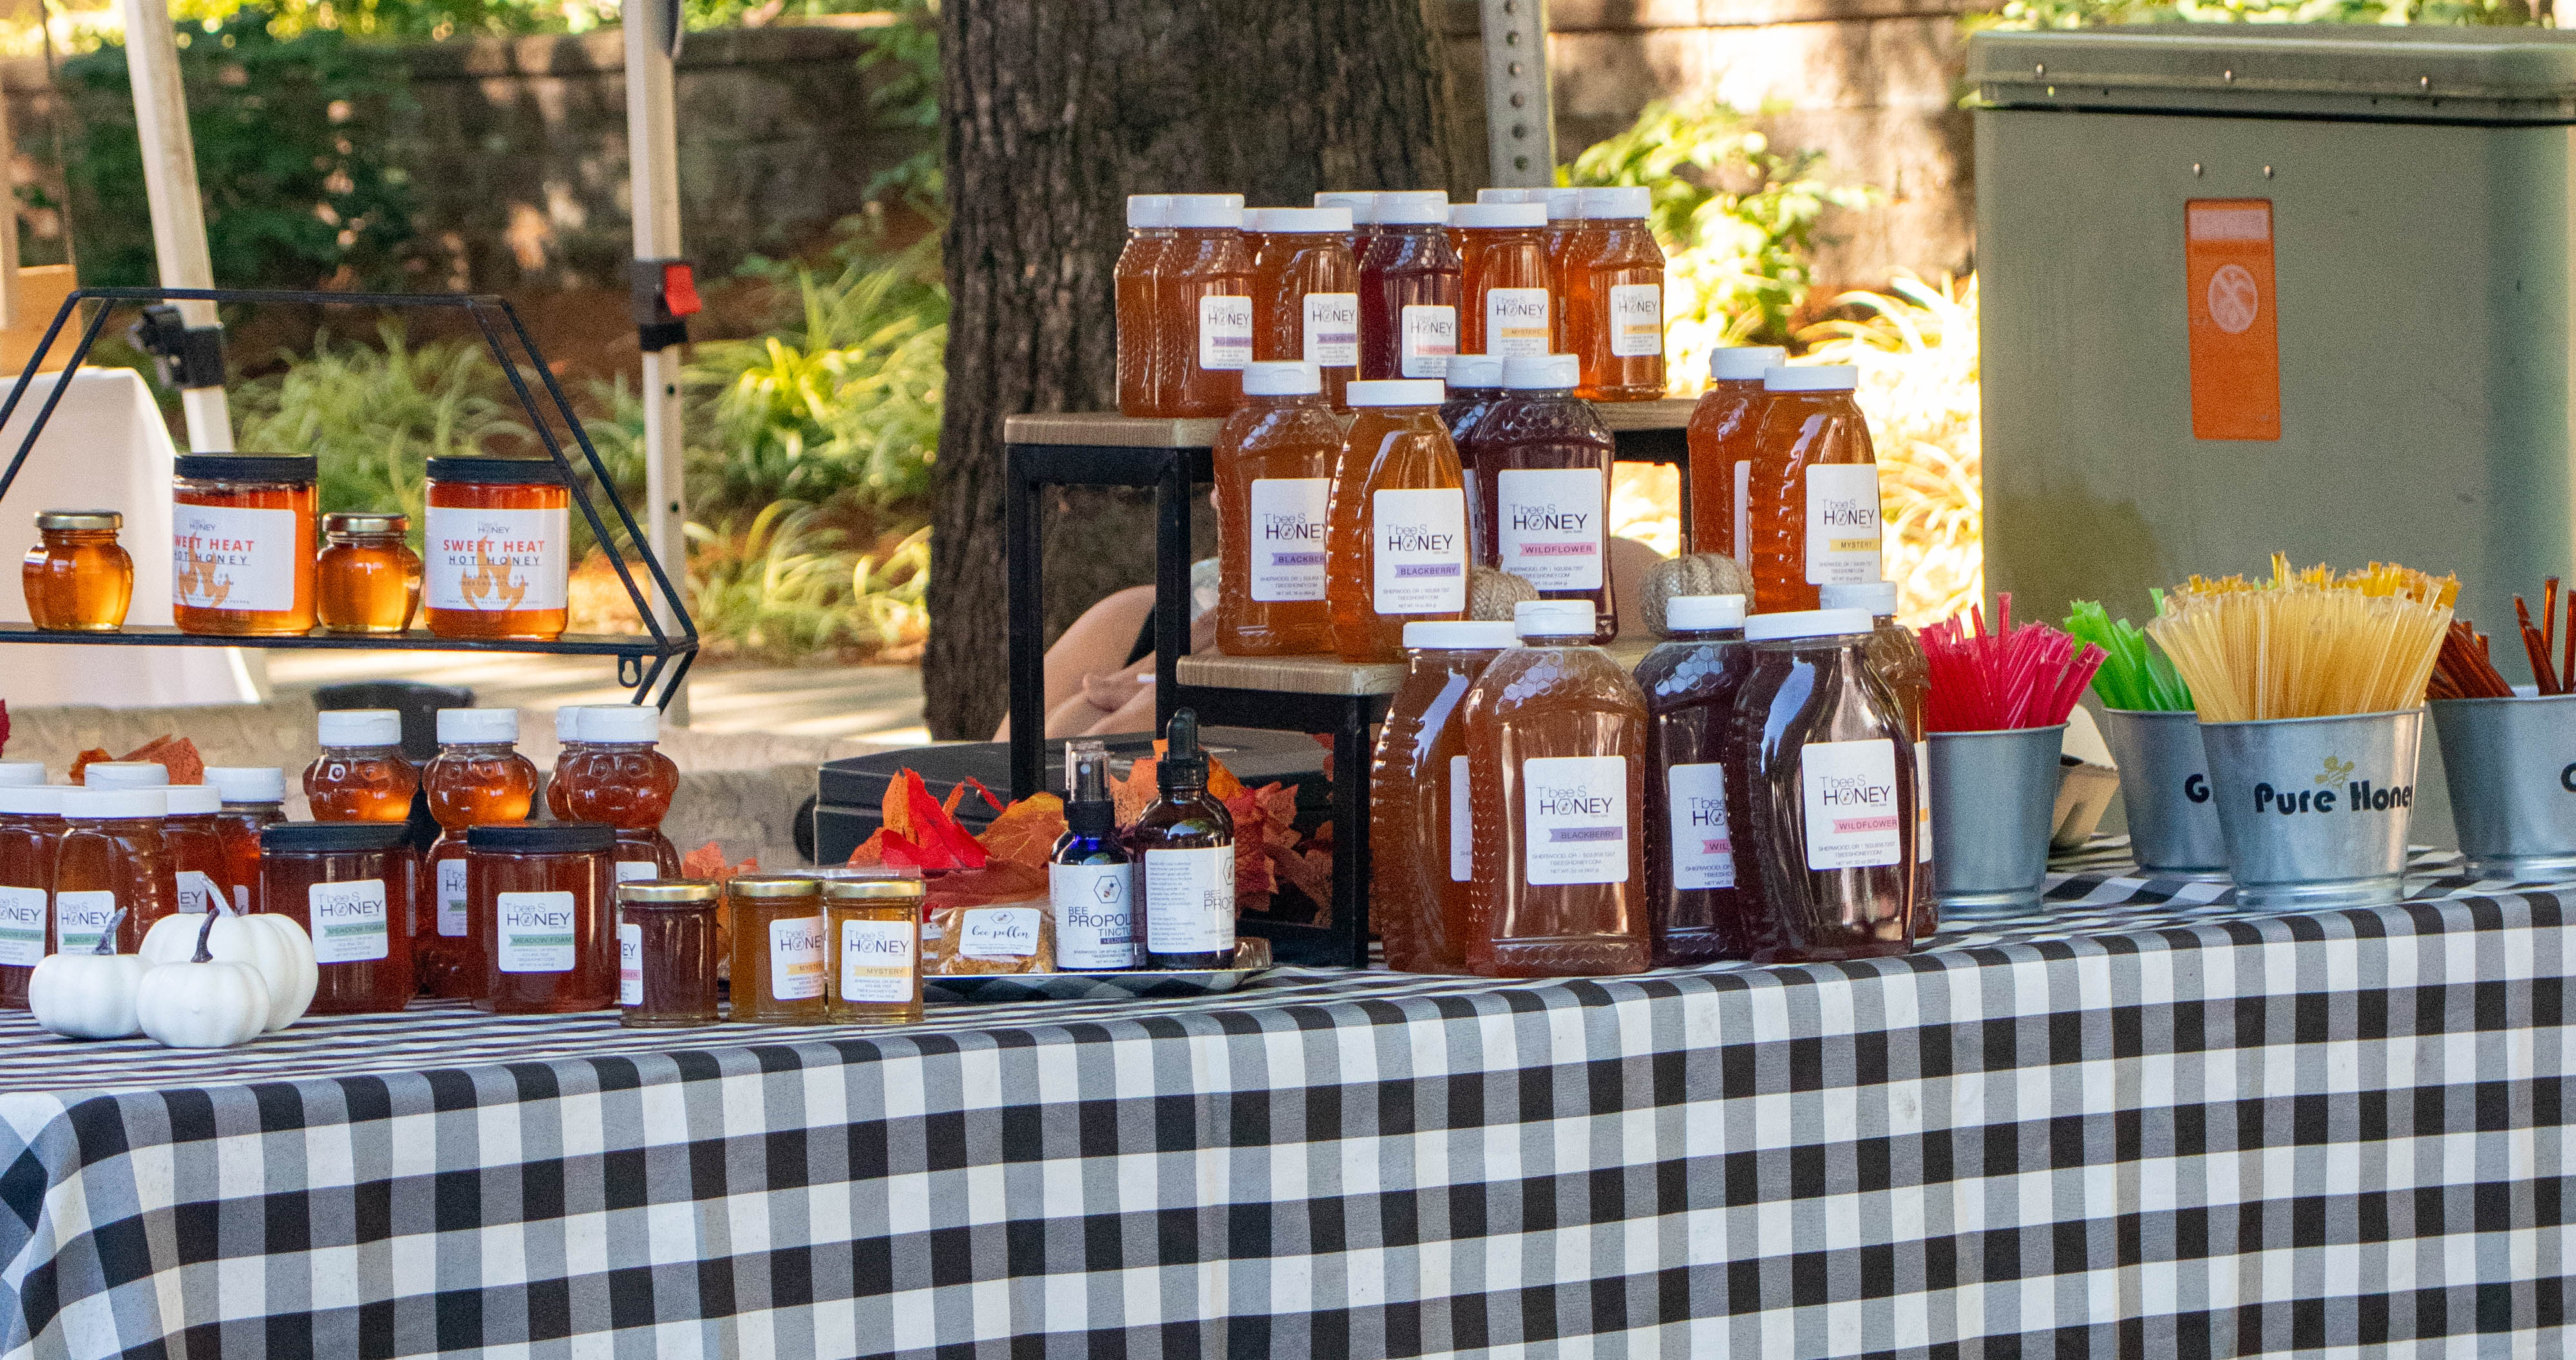

.jpg)
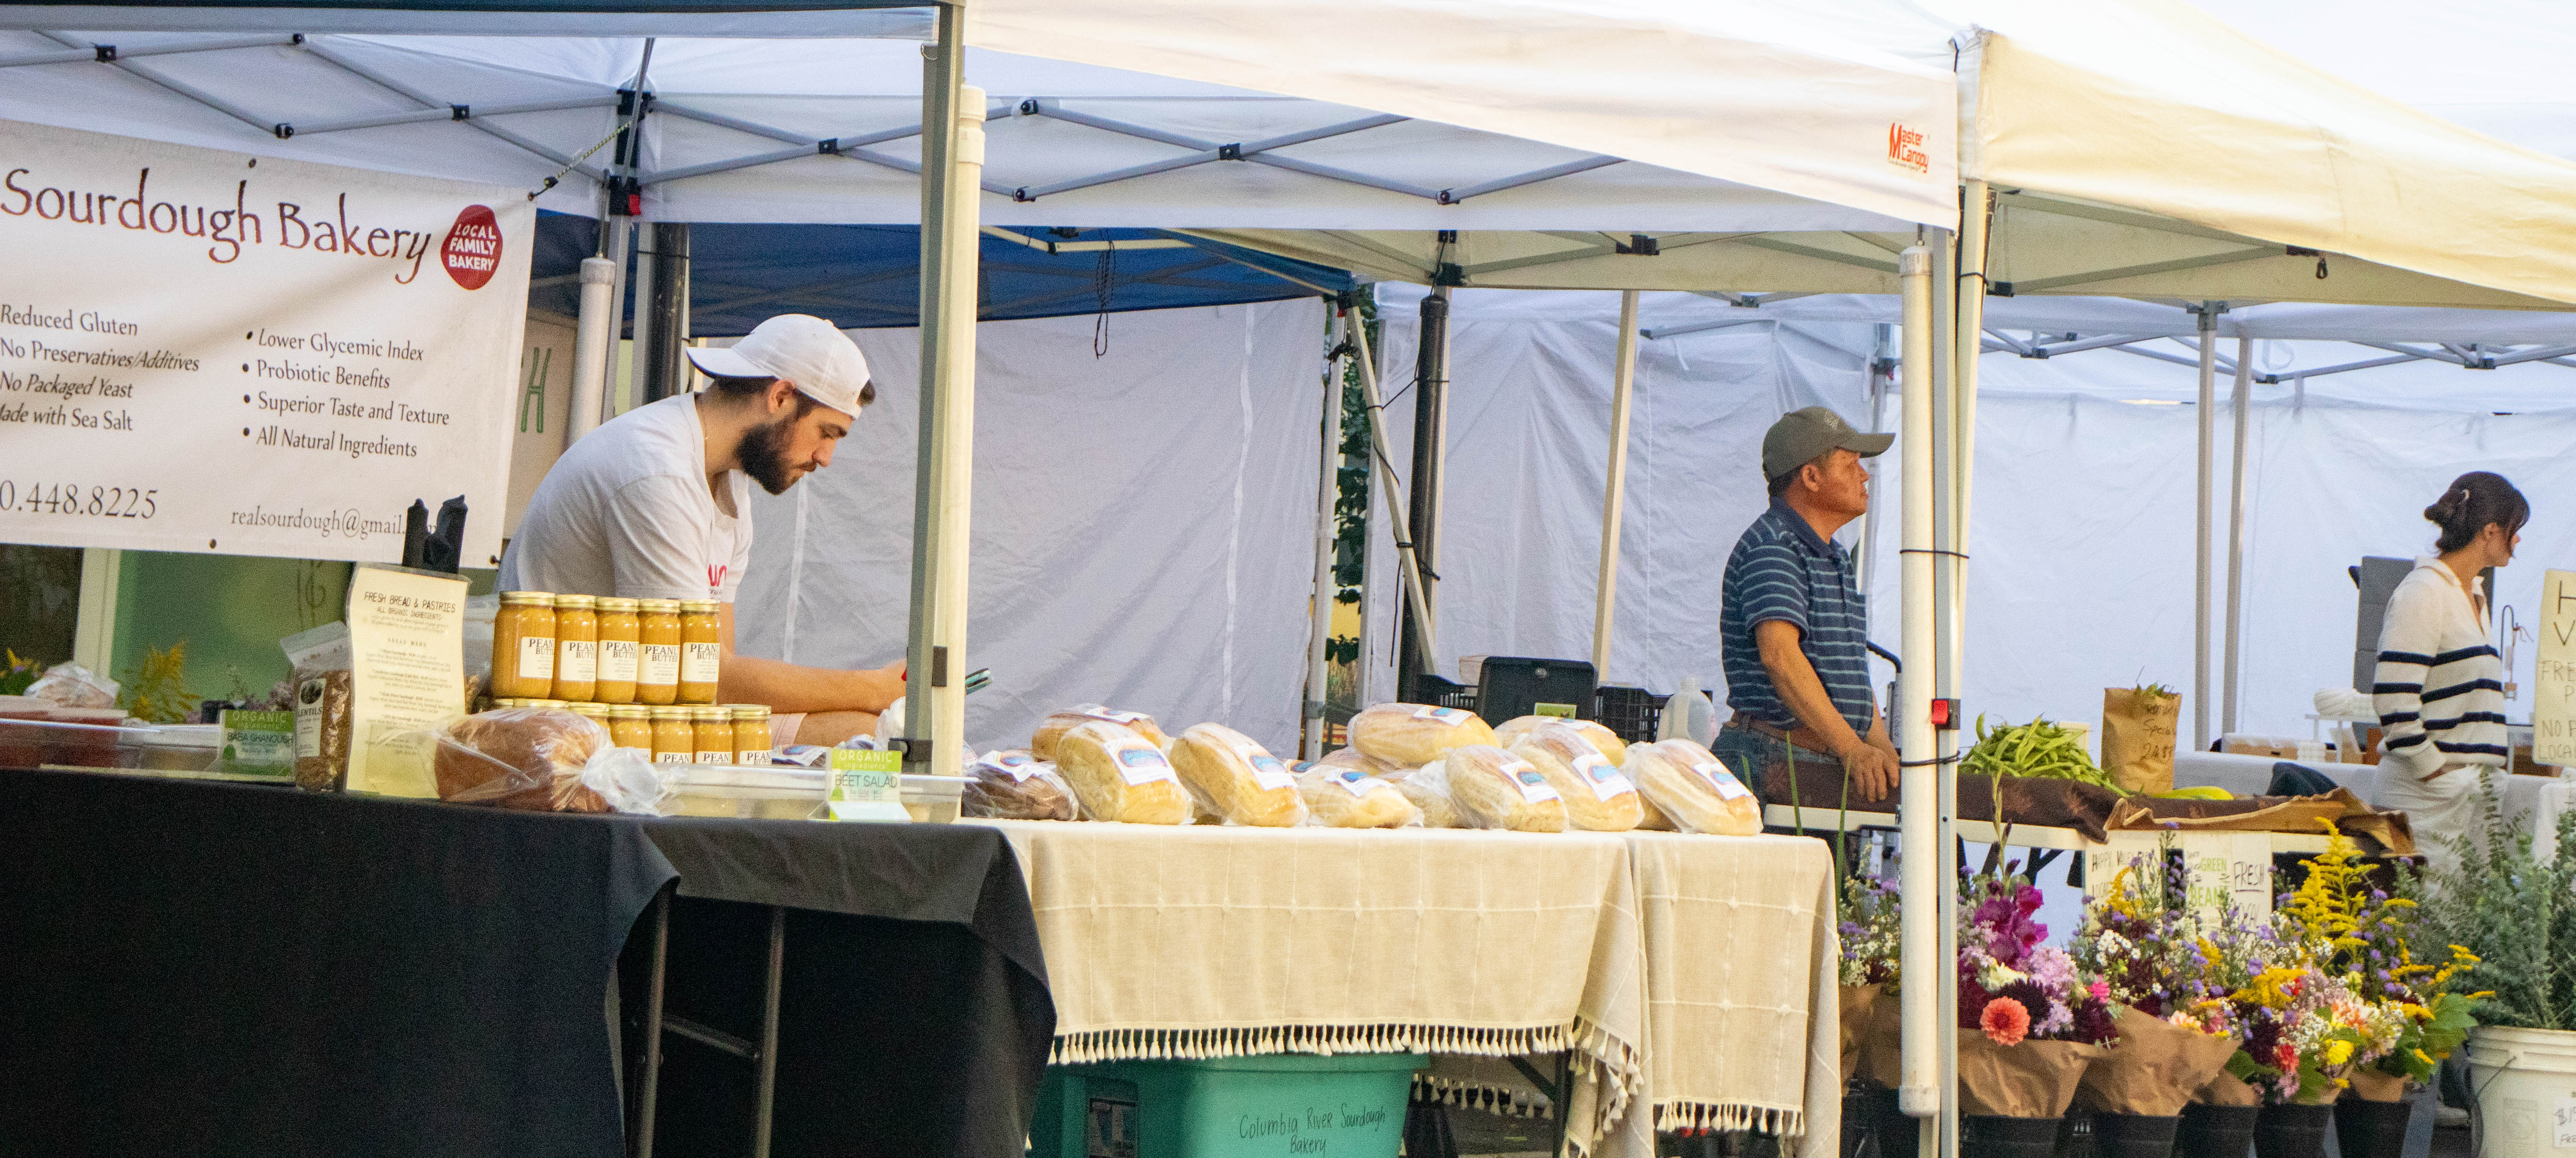
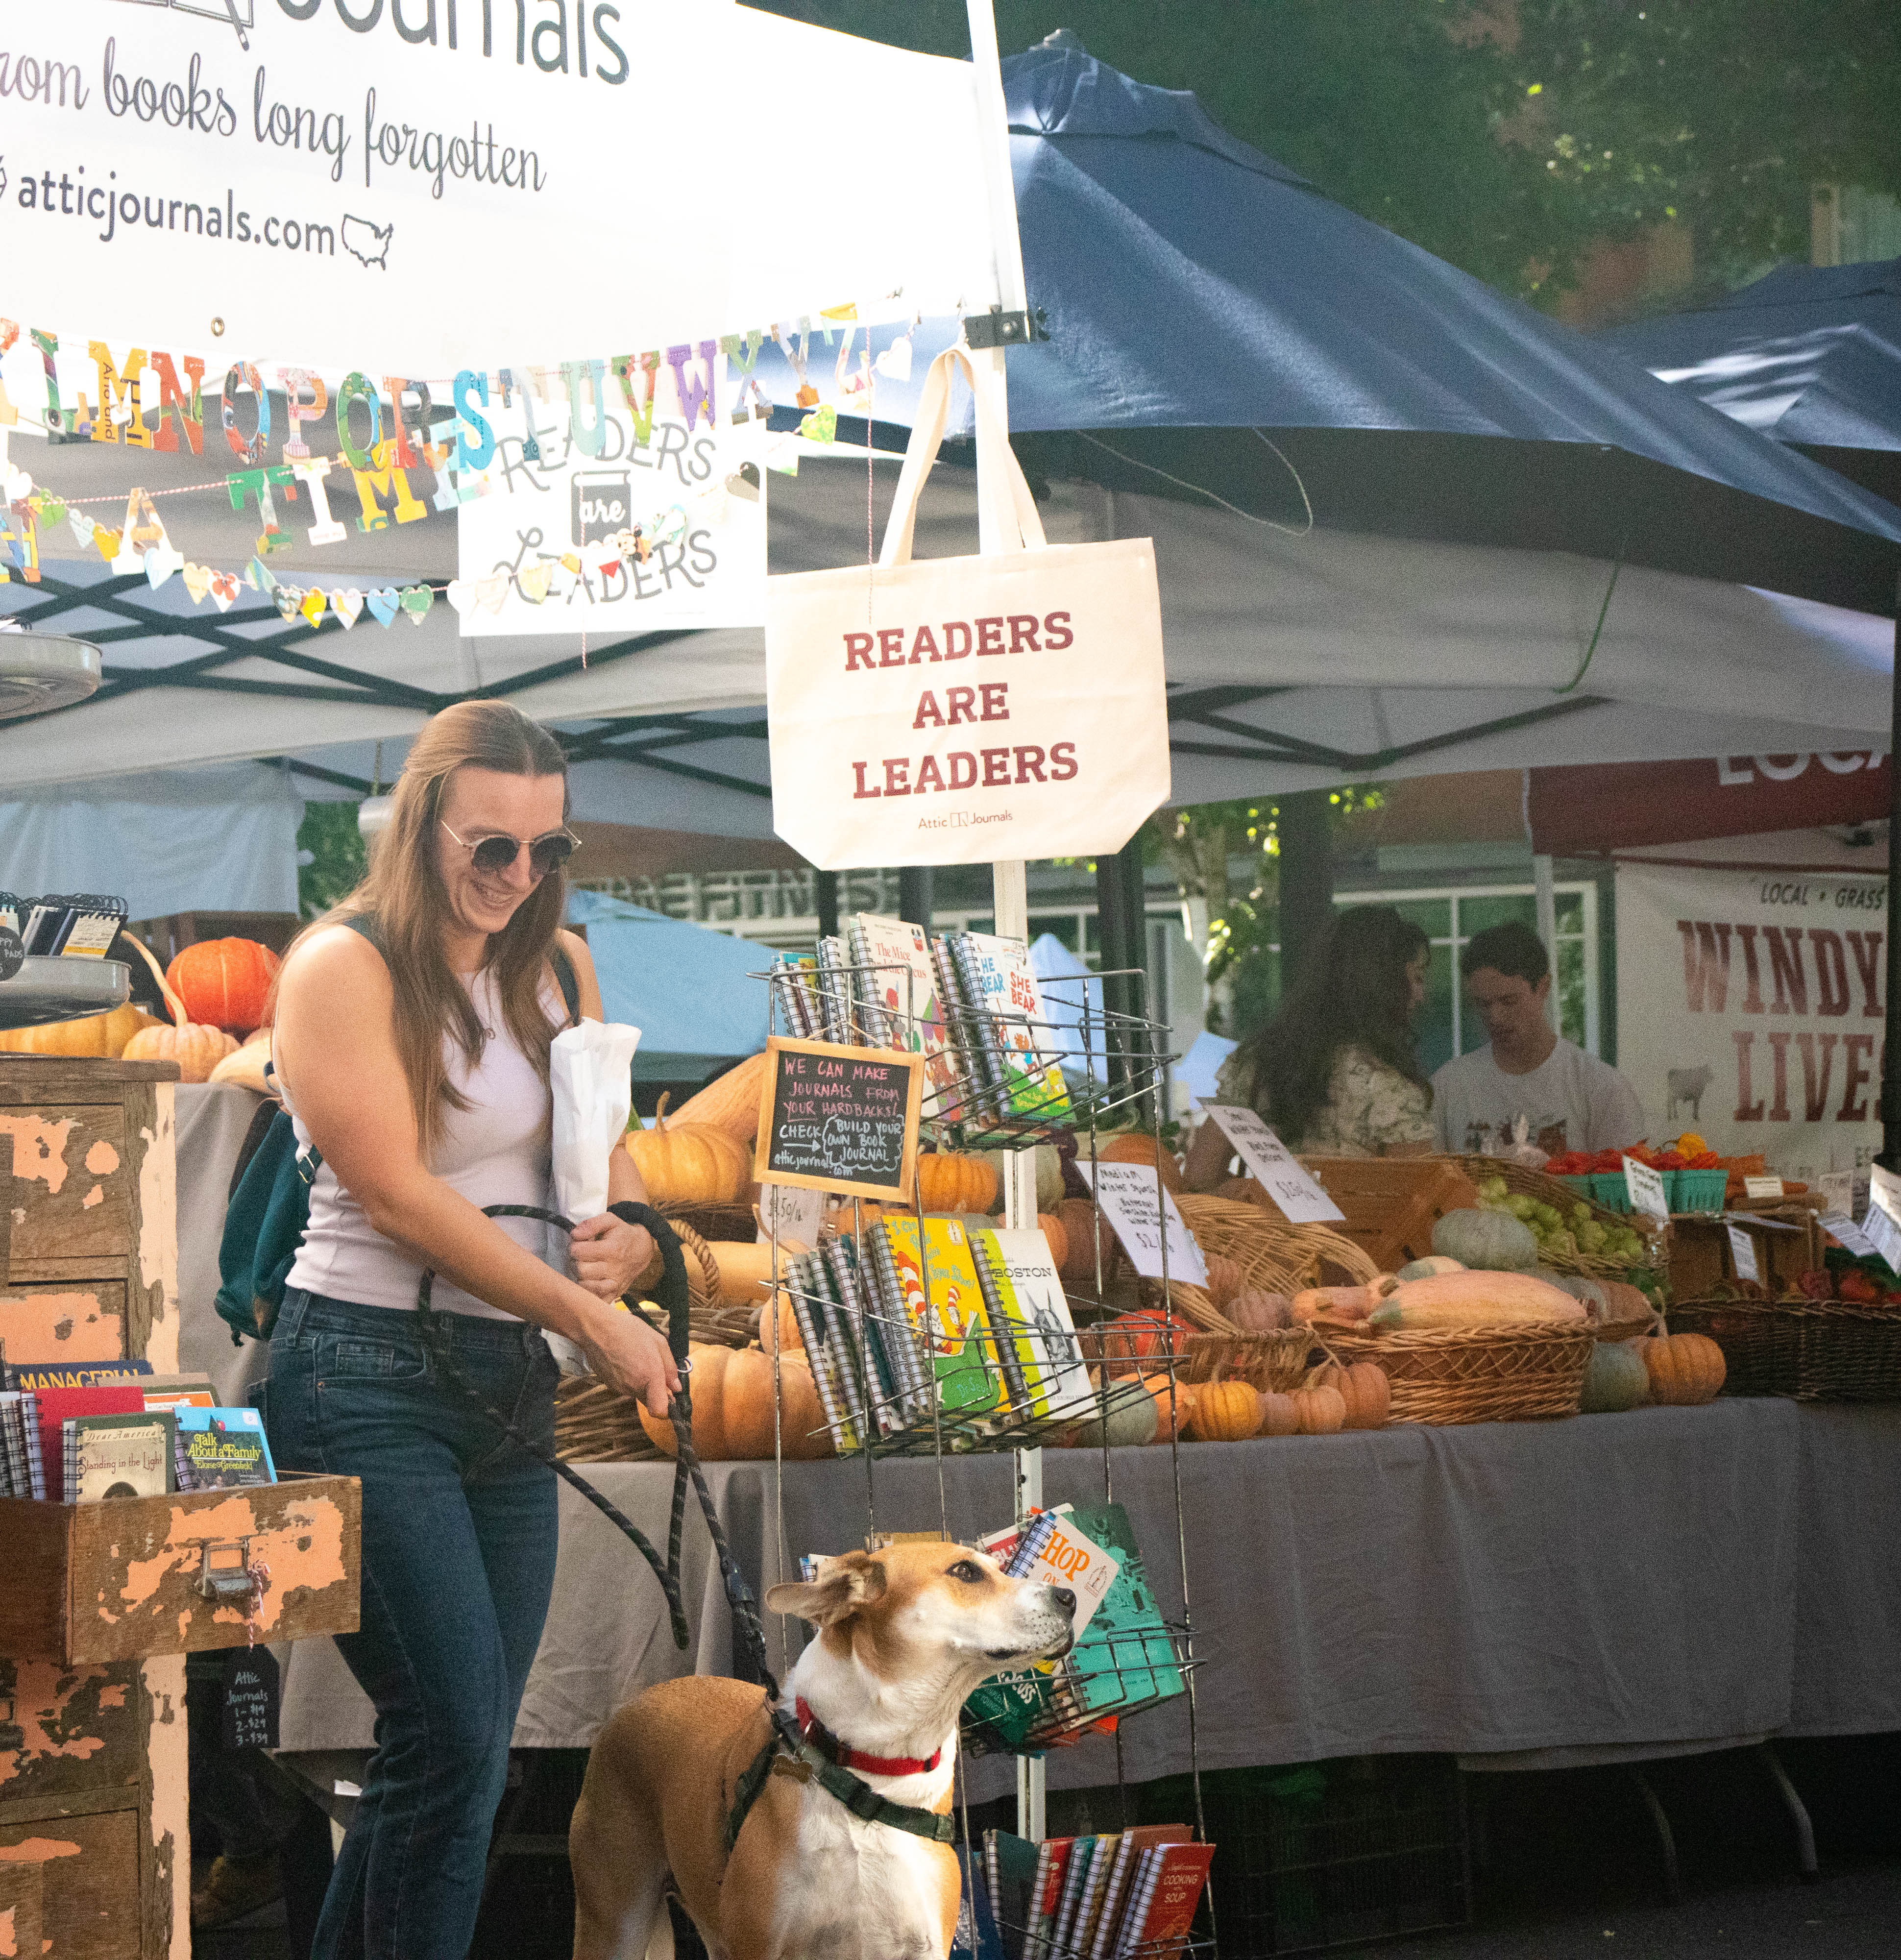
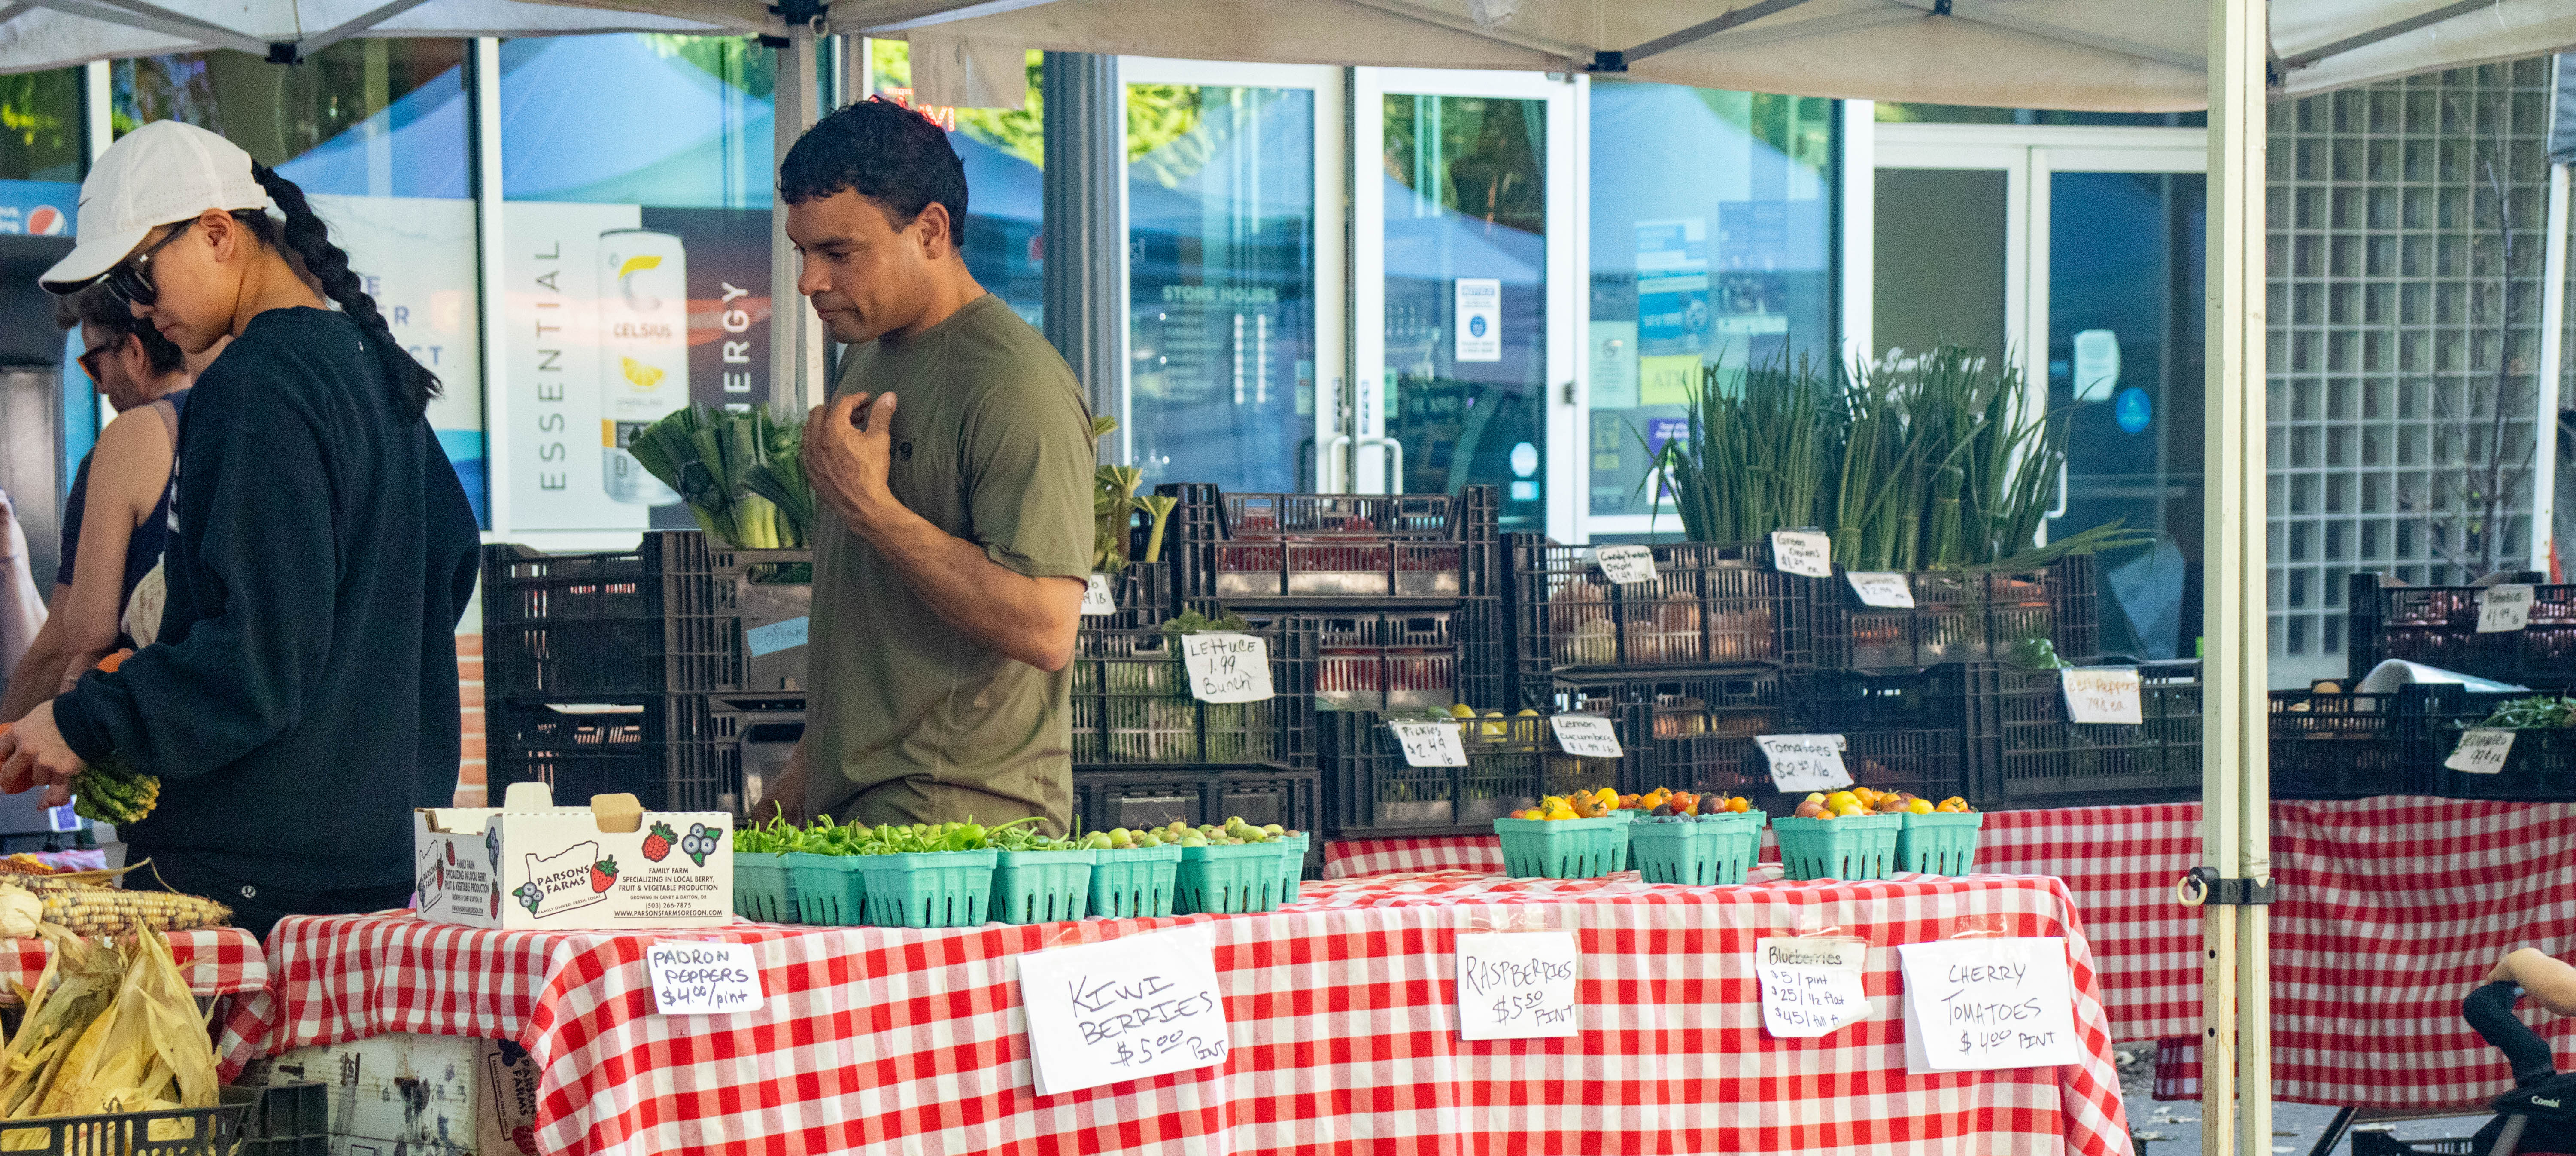
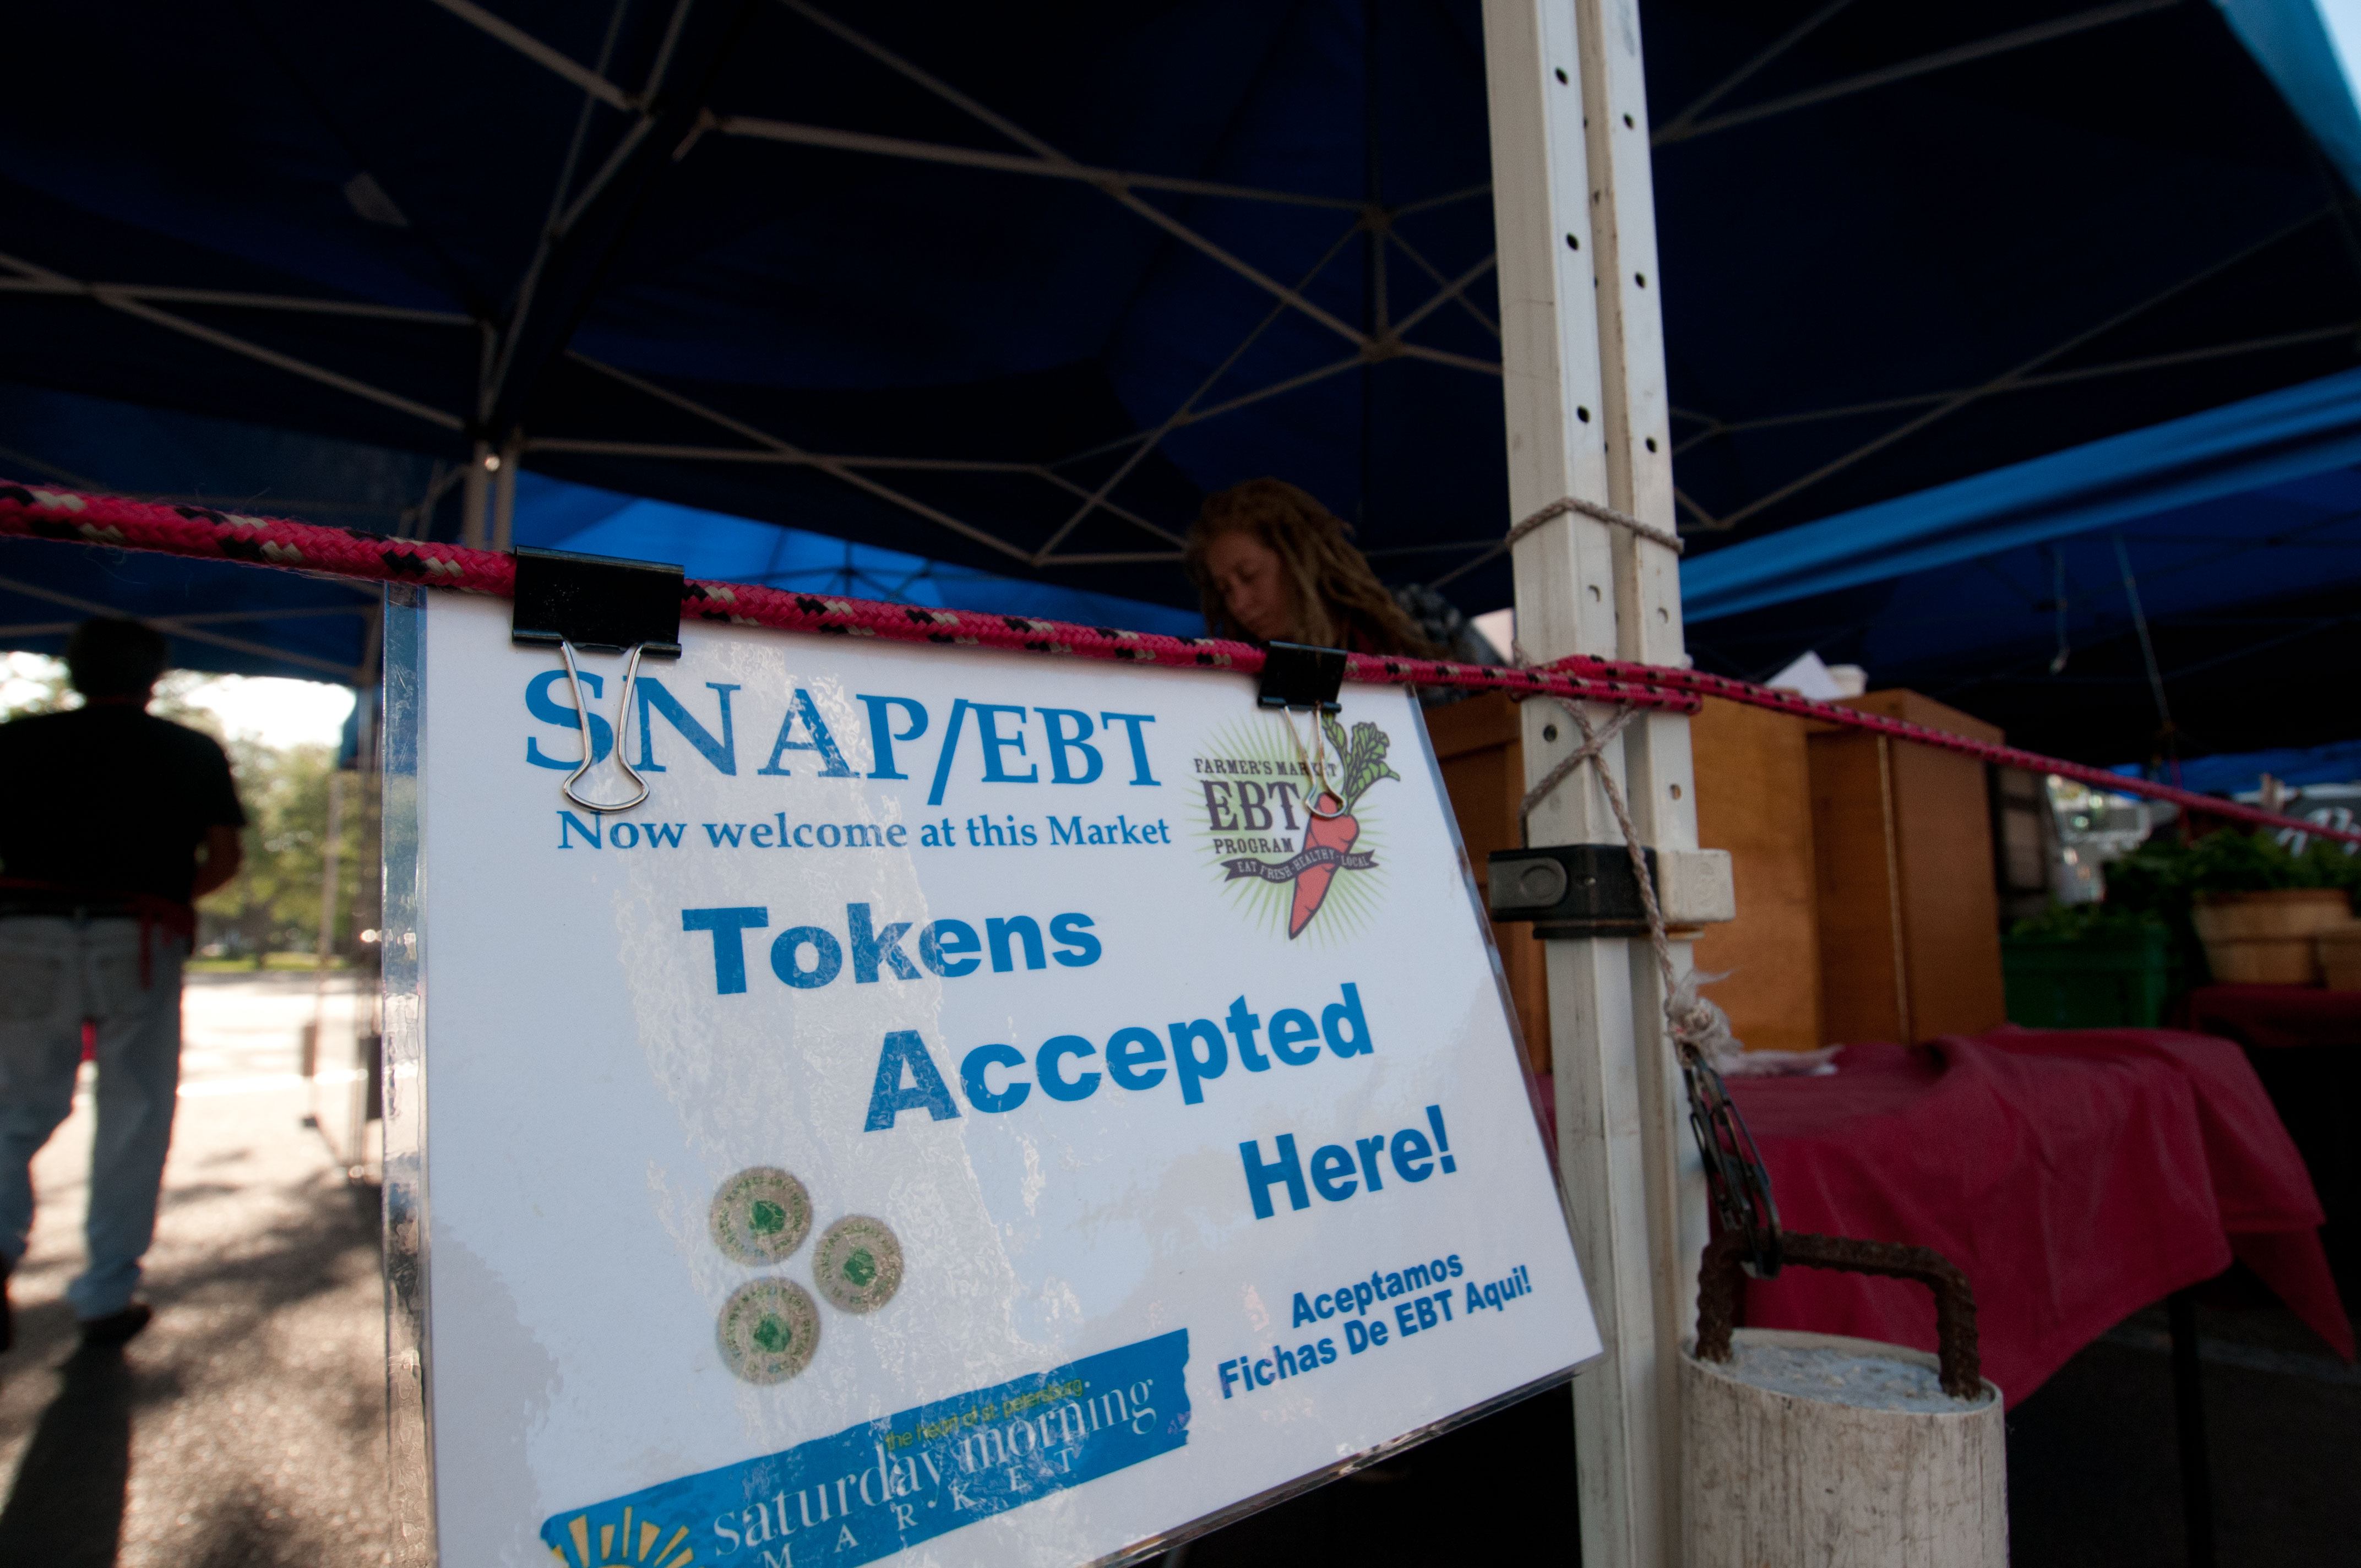
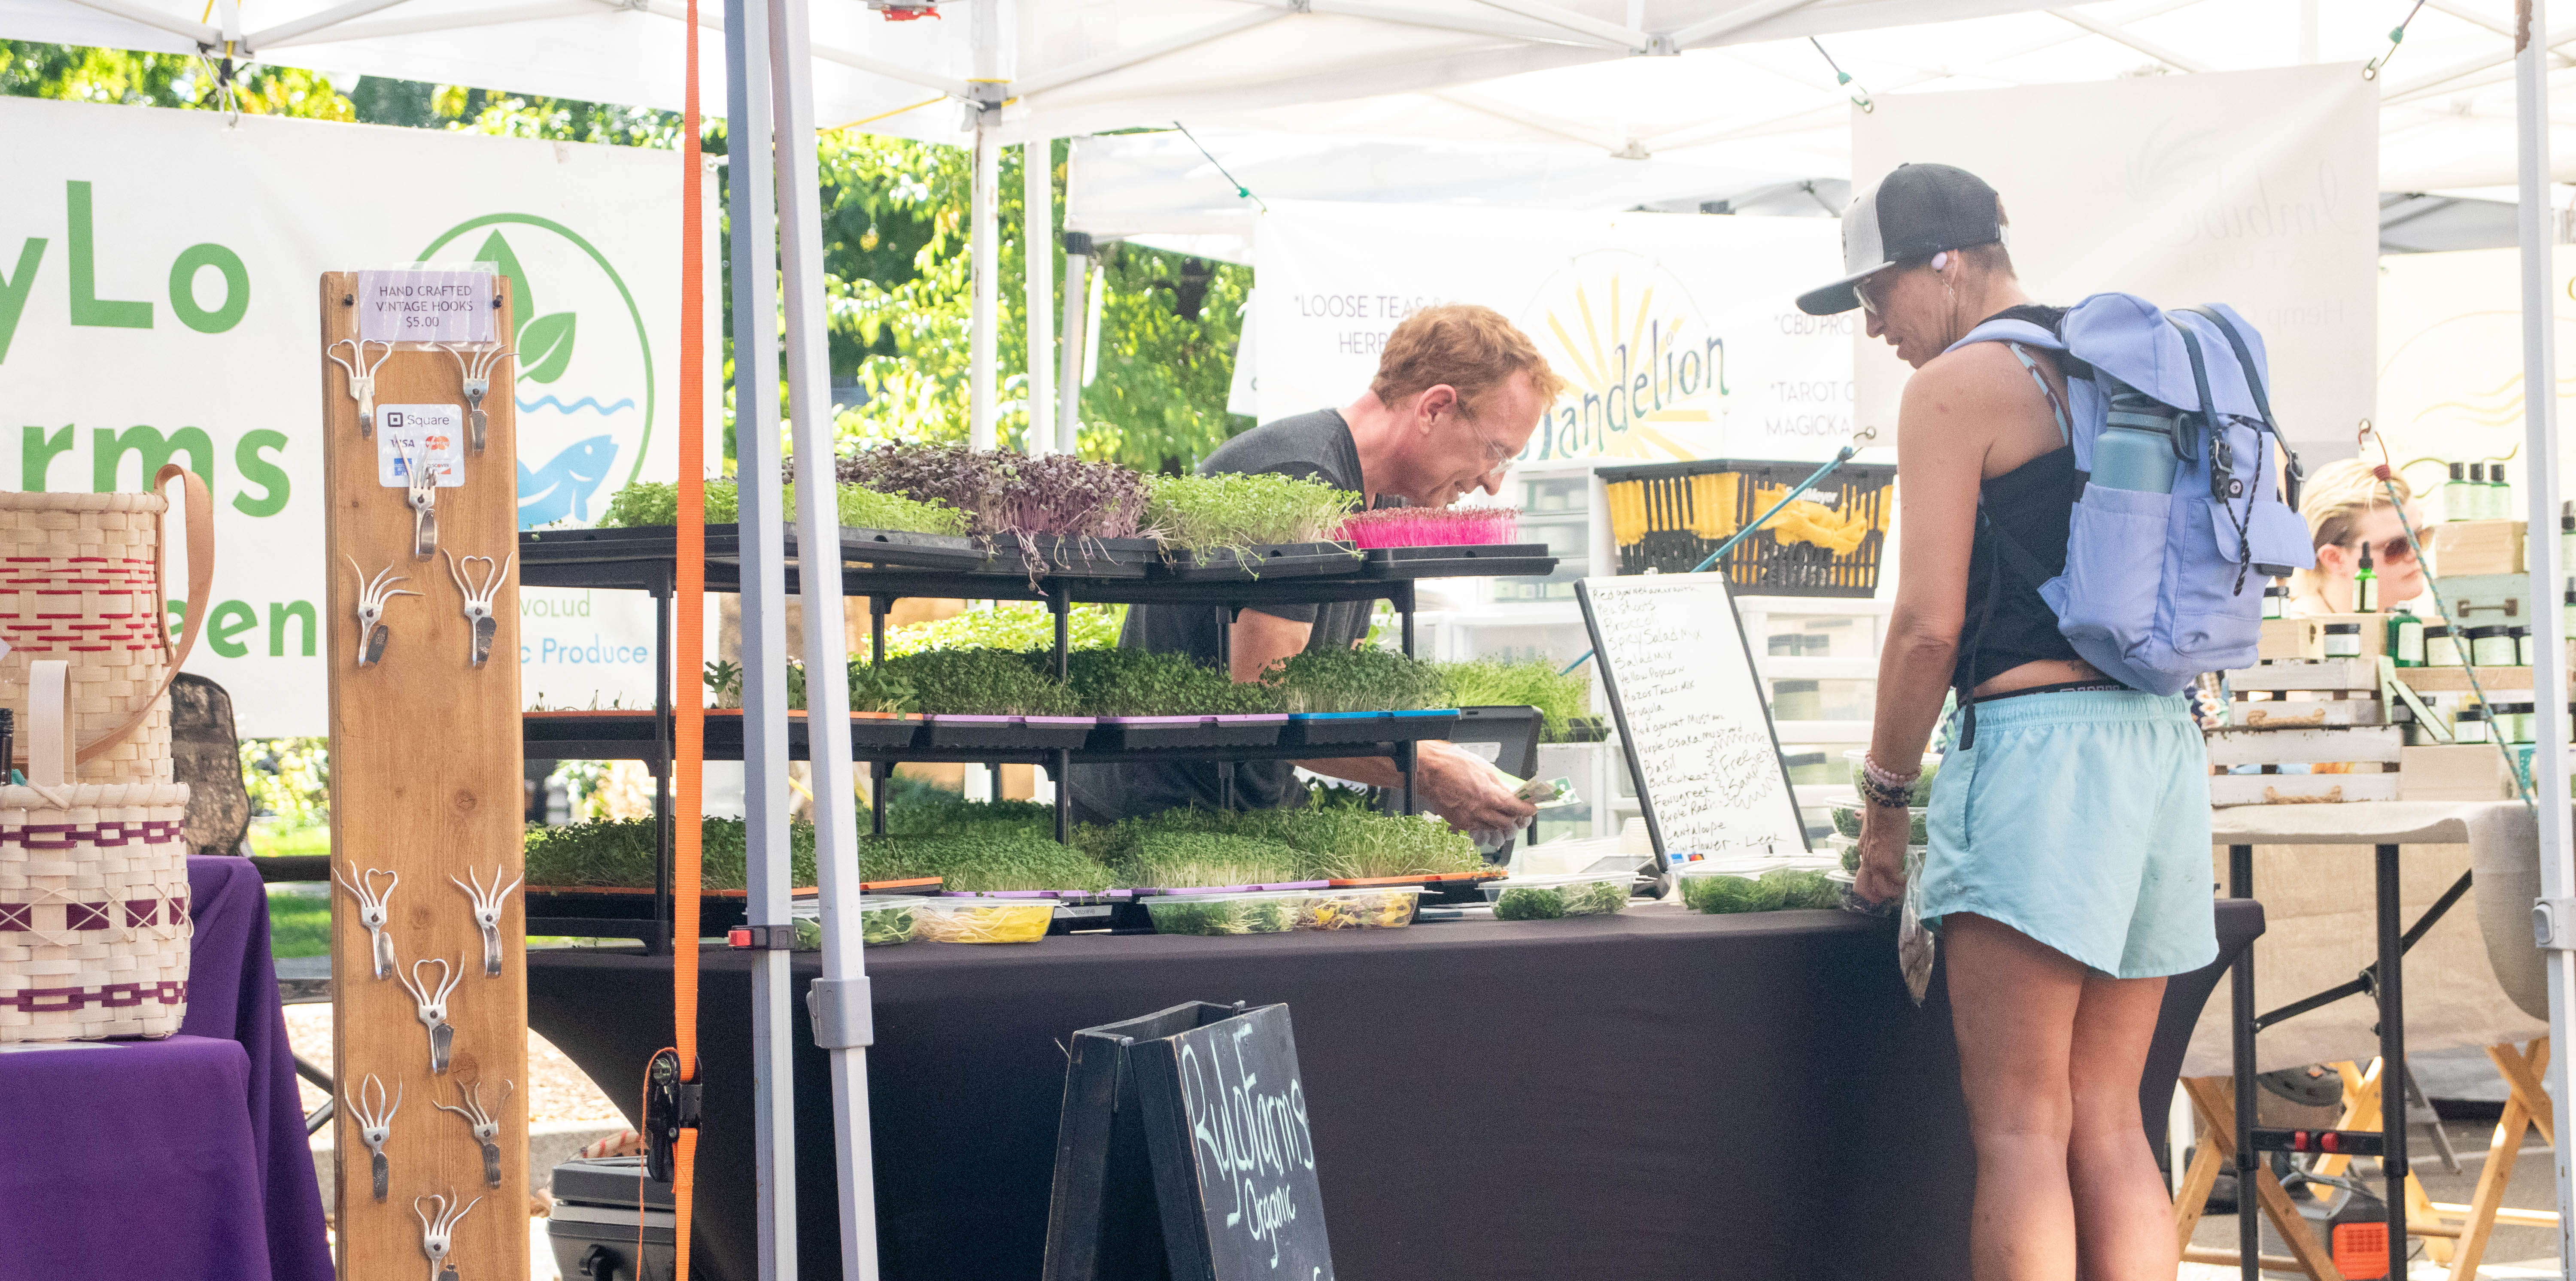
.jpg)
