To explore the data in more depth, please visit the Utah Priorities Project page.
Each gubernatorial election year since 2004, Utah Foundation has sought to understand what is important to Utah voters. The project uses surveys to compare voter priorities to candidates for Utah governor and political party delegates. For the 2016 election, Utah Foundation is again releasing the Utah Priorities Project. This first installment of a series of reports outlines voters’ top concerns as well as their ideological leanings. Subsequent reports will detail the top issues of the gubernatorial candidates and the party delegates.
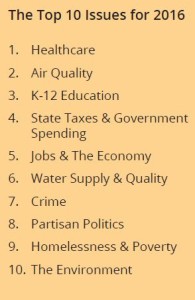 Jobs and the economy, the top priority in the last two gubernatorial elections (2010 and 2012), fell from first place. This year, the number one priority for Utah voters is healthcare. While healthcare has always been among the top five, two potential reasons for its rise in importance are the recent focus at the state level over Utah’s possible Medicaid expansion, and the sharp increase in the cost of healthcare for many Utahns in the past few years.
K-12 education has always been among the top three priorities, and this year it took third place. Environmental concerns also dominated the top ten issues with concerns about air quality ranking second, water supply and quality ranking sixth, and concerns about the environment in general ranking tenth.
KEY FINDINGS:
- Healthcare is the top concern for Utahns this year, likely due to the extended discussion on Utah’s Medicaid expansion and a sharp increase in healthcare costs (see page 3).
- While opinions of quality of life have improved since 2010, thoughts about whether the
state is “on the right track” remain stagnant (see page 2). - Utah Democrats are more liberal than their national counterparts. Unaffiliated Utahns are more conservative and Utah Republicans are as conservative as their national counterparts (see page 7).
- Democrats agree the most out of any breakout group on their top 10 list (see page 9).
- Demographic breakout groups have very different priorities. Top 10 lists for various
subgroups based on gender, ethnicity, age, religion, education, employment status, party affiliation, and other categories illustrate competing priorities (see pages 9-14). - The top five statewide issues can be found in almost every demographic breakout groups’ top 10 list (see page 9).
- Women and Wasatch Front respondents most closely mirrored the statewide top 10 list (see pages 10 and 12).
- Full-time employees and Gen Xers indicated that state taxes and government spending was their top priority (see page 11).
Crosstabs on these 21 priorities are available here