In March, Utah voters ranked jobs and the economy as the 12th most important of 15 competing priorities. However, by July the coronavirus pandemic reignited jobs and the economy as one of Utah voters’ top priorities. This mirrors Utah’s record-low unemployment rate in early 2020, which spiked to a record-high unemployment rate by April. While much of the economy is normalizing, the longterm economic strain of the pandemic remains unknown. By many broad metrics, the economic impact of the pandemic has been limited. However, aggregate measures have obscured the dramatic shifts in specific industries.
What most Concerns Utahns?
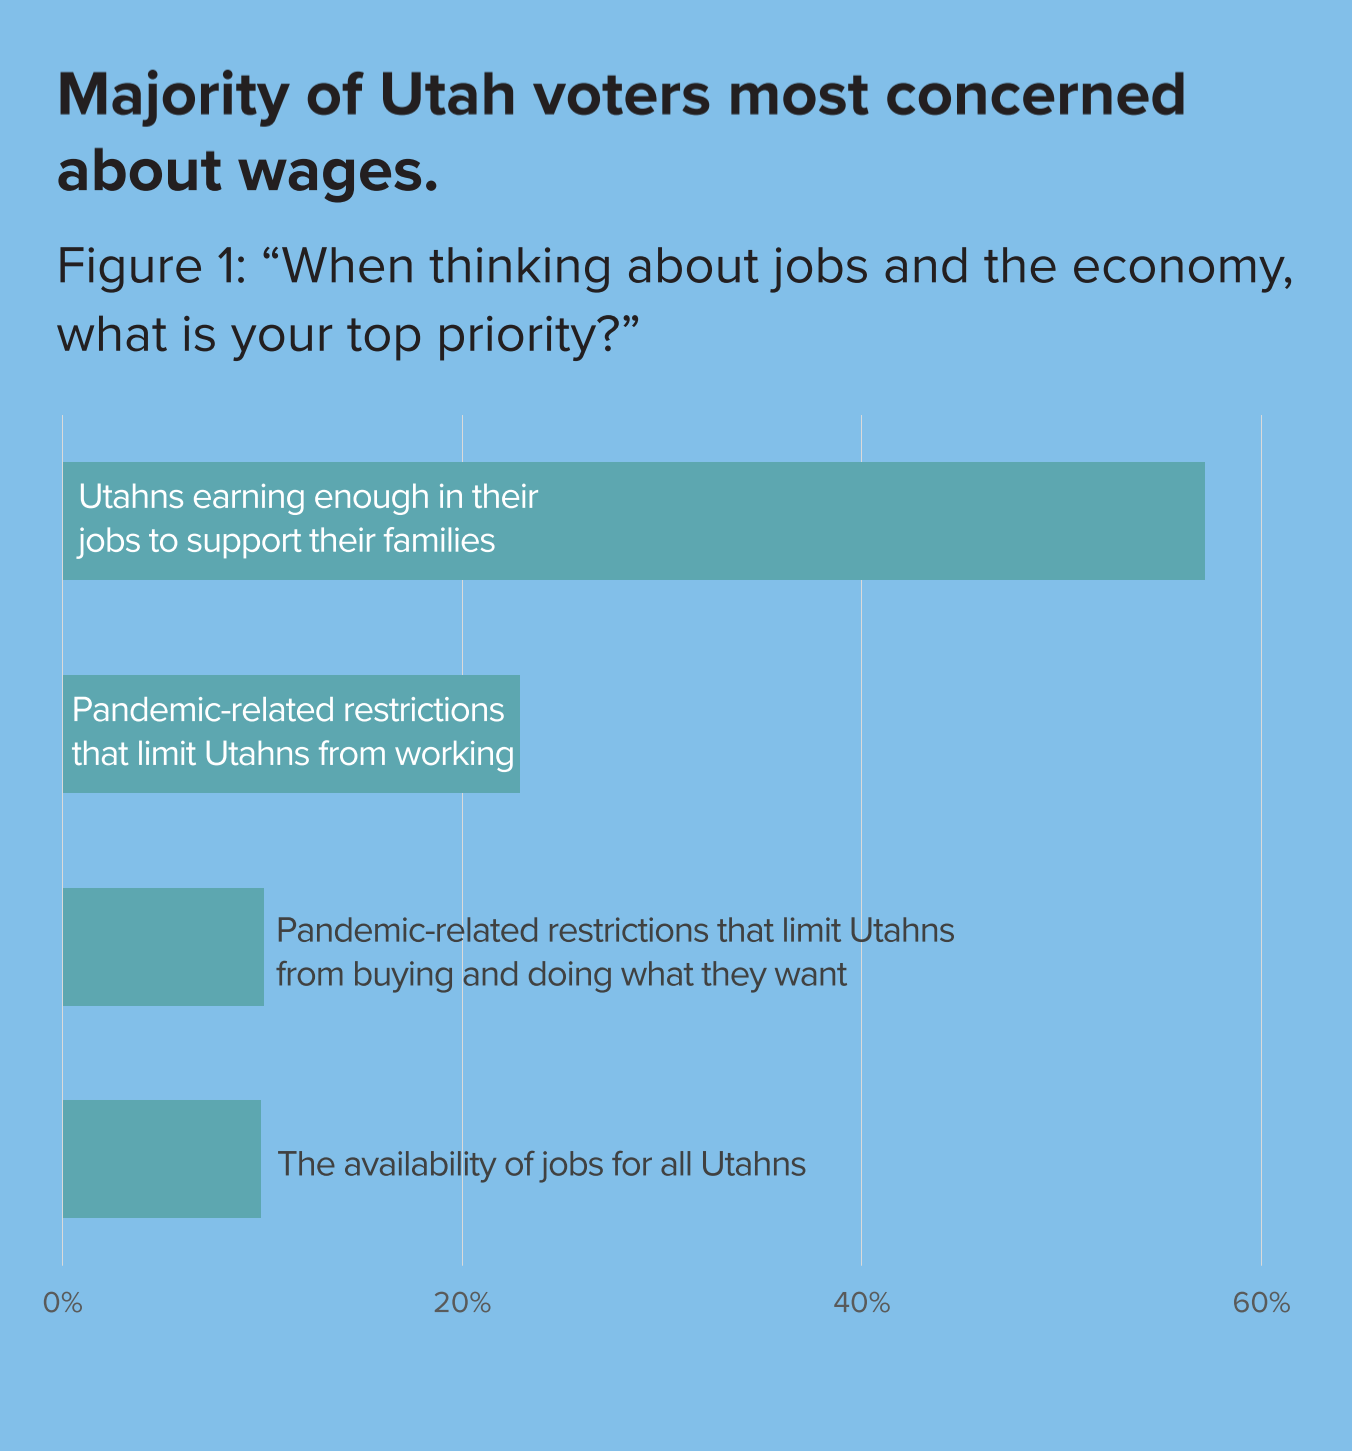
When thinking of jobs and the economy, most Utahns are concerned about the amount they earn in their jobs rather than the availability of jobs. This was also true before the pandemic.
In April, Utah’s governor issued an advisory to stay at home when possible and Salt Lake County issued a public health order which limited permissible economic activity. While these restrictions had been lifted by the time the second survey was administered, 10% of voters were still concerned about limitations on consumer spending while 23% were most concerned about work restrictions. These concerns differed by ideology. Liberal voters were more likely to be concerned about wages while conservative voters were more likely to be concerned about pandemic restrictions on consumer spending and working. However, only among Utah’s “strongly conservative” voters did more voters prioritize pandemic work restrictions over wages.
Wages and Cost of Living
The cost of living in Utah is near the national average – though a little higher in the Salt Lake City and St. George metro areas, and a littler lower across other major metro areas in the state.1 Nationally, the consumer price index (the CPI, which is a common metric for the cost of living and inflation) increased by 1.3% during the 12 months ending August 2020, the lowest increase since 2016. But the small increase belies larger changes in specific industries.2 Prices for food consumed at home increased by 4.6% during the 12 months ending August 2020 – and meat, poultry, fish and eggs increased by 7.1%. The price for medical services has also increased by 5.3%. On the other side of the scale, energy prices have decreased by 9%.
However, the pandemic has put the accuracy of the standard measure in question. The pandemic has increased challenges in collecting accurate data.3 Further, since the CPI measures the price changes in a set basket of goods, if the ratio of those goods change, the CPI may miss the cost of living. While lower energy prices may normally offset higher food prices, people have changed spending habits to purchase more food but less energy-related items such as transportation services. As a result, the official measure may be understating the true rise in the cost of living.4
Then there’s the question of wages. Two separate surveys conducted by the U.S. Census Bureau offer conflicting information regarding wages in Utah since the onset of the pandemic. The Current Population Survey (a well-established survey for workforce data) reports that average weekly wages as of June 2020 did not significantly differ from wages of previous years.5 Yet the Household Pulse survey (a new survey meant to provide up-to-date information on the pandemic) reports that, as of mid-July, nearly half (45%) of Utah’s households had a worker that lost income since the onset of the pandemic.6
Unemployment and Availability of Jobs
Unemployment always exists at some level and is generally considered normal even within the 4% to 6% range. The pandemic caused unprecedented levels of unemployment virtually overnight, spiking from historic lows in early 2020 to 10.4% in April. The unemployment rate since fell to 4.1% as of August – below Utah’s longterm average. However, not all counties in Utah are facing the same conditions. As of August, Cache County has an unemployment rate below 3%, while Garfield and San Juan counties are still in the double digits.7
Pandemic-related unemployment is disproportionately affecting certain industries and age groups. As of the second quarter of 2020 (April, May and June), the food preparation and service industry saw the largest spike in unemployment, followed closely by office and administrative support, sales, and management.8 Utahns between 25 and 34 years of age made up a quarter of Utahns who had lost their job and had yet to find another.9 However, some industries have grown during the past 12 months. The trade, transportation and utilities industries, as well as construction, added more than 13,000 jobs.10
Consumer Spending
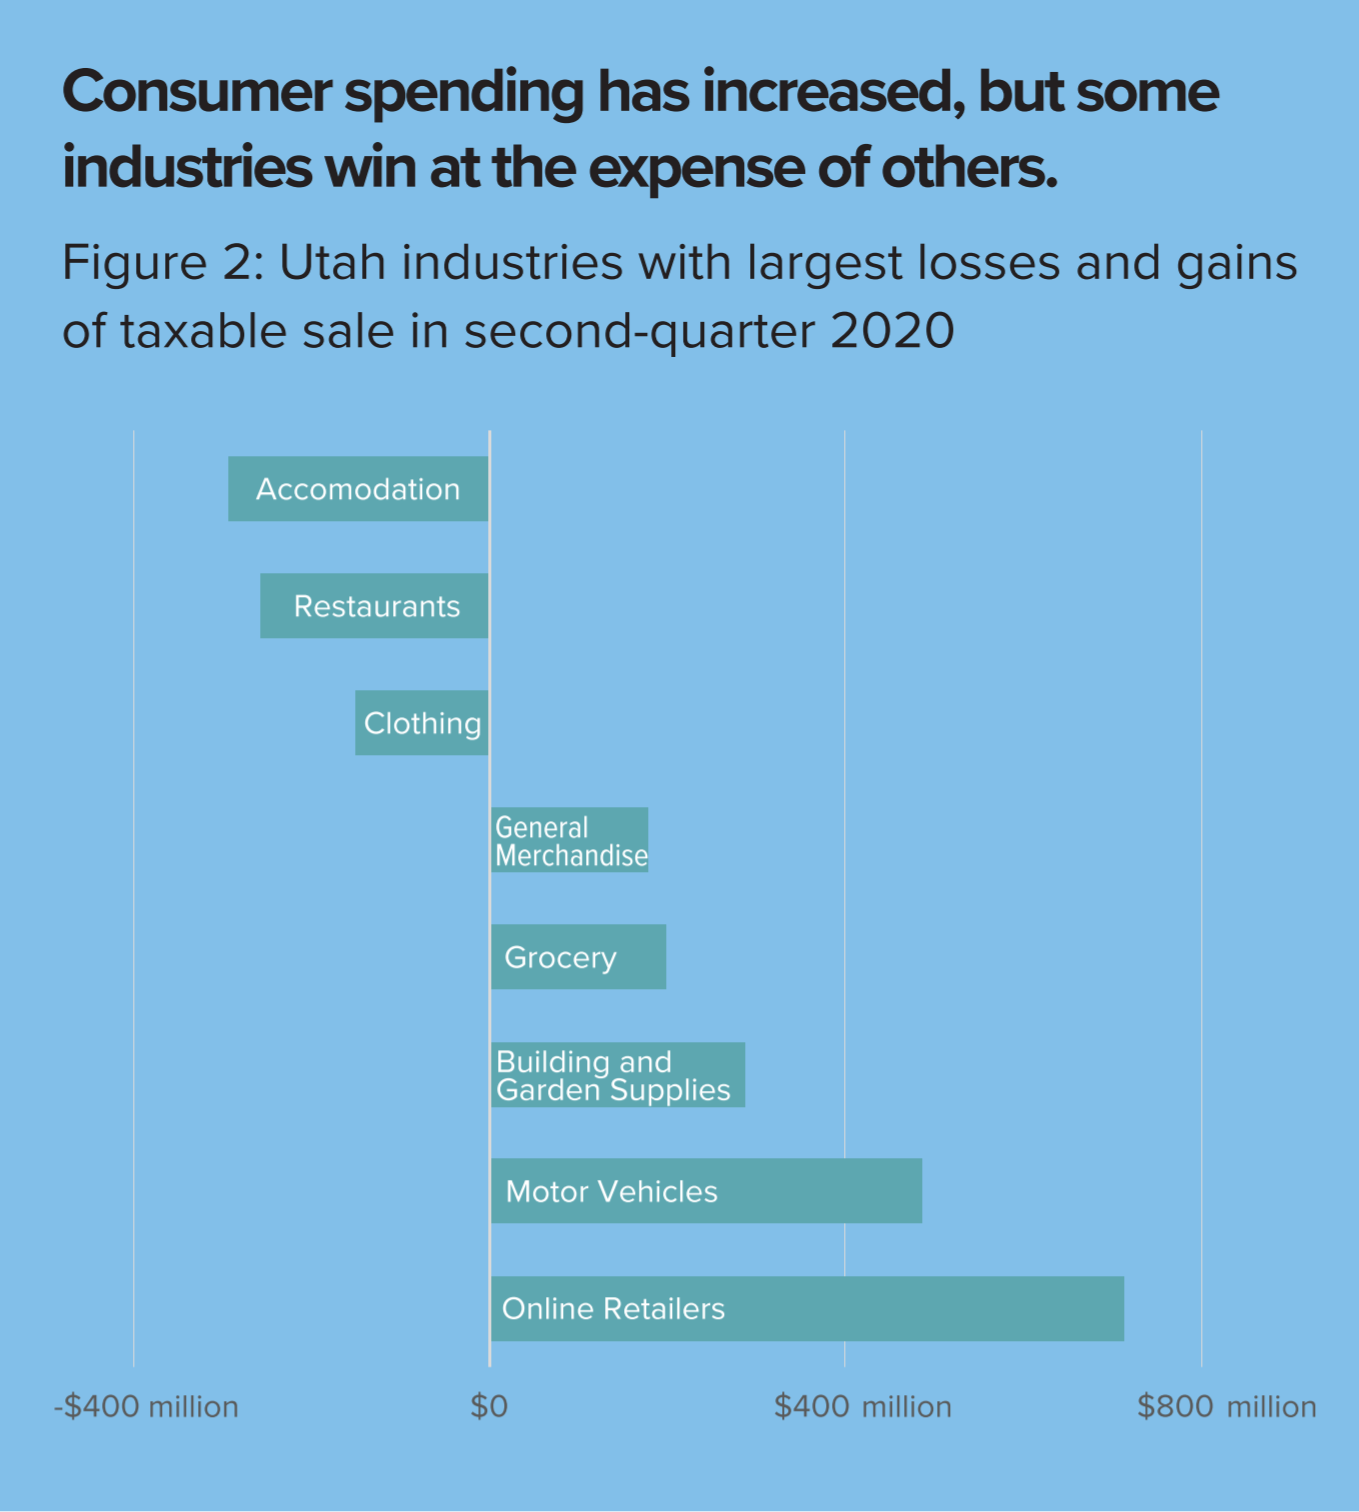
Source: Utah State Tax Commission
While Utahns have had to adapt to additional restrictions and health measures, it has not slowed down overall consumer spending based on data collected by the Utah State Tax Commission. Spending has actually increased over the previous year, though Utahns are spending their money in different places. During the second quarter of 2020, Utahns spent $800 million less in food services, arts and entertainment, accommodation, and retail clothing. However, this was almost completely counterbalanced by the $700 million increase in spending on online sales alone. In addition, there was another $700 million increase on vehicles and on building and garden supplies. (See Figure 2.) There is evidence that stimulus payments and higher unemployment benefits have helped maintain consumer spending.11
Restrictions on Jobs
Salt Lake County’s March 16th public health order prohibited the operation of all food service, restaurants, self-serve buffets, salad bars, un-packaged self-serve food services, bars, taverns, nightclubs, private liquor clubs and saloons, except for drive-thru or curbside service.12 This order forced many food service establishments – which employ at least 45,000 across the county – to limit their operations.13 The county’s March 29th order further prohibited the operation of personal care, recreational and culture facilities services. This meant normal operations at these facilities – which employ at least 12,000 across the county – were illegal.14 The restriction was renewed in April and expired on the 1st of May.15 While the restriction had lifted by the time the second Utah Priorities Project survey was administered, when thinking about jobs and the economy, 23% of Utah voters’ top priority was pandemic-related restrictions that limit Utahns from working
Conclusions
While Utah’s economy took a hit from the coronavirus, Utah appears to be among the states experiencing the fastest recovery. Utah’s unemployment rate is the second lowest in the nation, and already below its historical average.16 Consumer spending through the second quarter has been increasing with double-digit growth rates, and average weekly earnings have been trending slightly upward. If Utah can manage to keep coronavirus caseloads under control, it may come to be seen as a model state for keeping the population safe without sacrificing its economy.
Endnotes
- ^Utah Department of Workforce Services, “Consumer Price Index (CPI) and cost of living comparisons,” 2020 1st Quarter data, https://jobs.utah.gov/wi/data/library/wages/ costofliving.html.
- ^U.S. Bureau of Labor Statistics, “Consumer prices up 1.3 percent in 12 months ended August 2020,” (Sep. 17, 2020), https://bls.gov/opub/ted/2020/consumer-prices-up-1-point-3percent-in-12-months-ended-august-2020.htm.
- ^U.S. Bureau of Labor Statistics, “Effects of COVID-19 pandemic and response on the Consumer Price Index,” (Sep. 11, 2020), https://www.bls.gov/covid19/effects-of-covid19-pandemic-on-consumer-price-index.htm.
- ^Cavallo, Alberto, “Inflation with Covid consumption baskets,” NBER Working Paper; No. w27352, (June 2020), available at SSRN: https://ssrn.com/abstract=3626853.
- ^Flood, Sarah, Miriam King, Renae Rodgers, Steven Ruggles and J. Robert Warren, “Integrated Public Use Microdata Series, Current Population Survey: Version 7.0,” [dataset], Minneapolis, MN: IPUMS, 2020. https://doi.org/10.18128/ D030.V7.0.
- ^U.S. Census, “Household Pulse Survey PUF: July 9 – July 14,” (Jul. 14, 2020), https://www.census.gov/programs-surveys/ household-pulse-survey/datasets.html.
- ^Utah Department of Workforce Services, “Current county unemployment: Seasonally adjusted Unemployment Rates,” (Aug. 21, 2020), https://jobs.utah.gov/wi/data/library/ employment/countyunemployment.html.
- ^Utah Department of Workforce Services, “Employment update – Industry statistics – Unemployment insurance claims,” (Aug. 21, 2020), https://jobs.utah.gov/wi/data/ misstats/Unemployment_Claims/.
- ^Ibid.
- ^Utah Department of Workforce Services, “Employment update – Industry,” (Aug. 21, 2020), https://jobs.utah.gov/ wi/update/empind/.
- ^Baker, Scott R., R. A. Farrokhnia, Steffen Meyer, Michaela Pagel and Constantine Yannelis, “Income, Liquidity, and the Consumption Response to the 2020 Economic Stimulus Payments,” NBER Working Paper No. 27097 (Sep. 2020) https://nber.org/papers/w27097; Farrell, Diana, Peter Ganong, Fiona Greig, Max Liebeskind, Pascal Noel and Joe Vavra, “Consumption effects of unemployment insurance during the COVID-19 pandemic,” JPMorgan Research Institute, (Jul. 2020),https://institute.jpmoreganchase.com/institute/research/labor-markets/unemployment-insurance-covid19-pandemic.
- ^Salt Lake County Board of Health, “Public health order 2020-01,” (Mar. 16, 2020), https://slco.org/contentassets/ f58c33aea22d45c68bce7de8b4005f46/public-health-ordercovid-19march-16-2020.pdf.
- ^Impacts estimated by job title information provided by the Department of Workforce Services, “Utah Economic Data Viewer: Occupation information,” https://jobs.utah. gov/jsp/utalmis/#/occupation. Occupations included Bakers; Bar tenders; Chefs and Head Cooks; Combined Food Preparation and Serving Workers, Including Fast Food; Cooks, Fast Food; Cooks, Institution and Cafeteria; Cooks, Restaurant; Cooks, Short Order; Counter Attendants, Cafeteria, Food Concession, and Coffee Shop Barista; Dining Room and Cafeteria Attendants and Bartender Helpers; Dishwashers; First-Line Supervisors of Food Preparation and Serving Workers; Food Batchmakers; Food Preparation Workers; Food Service Managers; Waiters and Waitresses
- ^Impacts estimated by job title information provided by the Department of Workforce Services, “Utah Economic Data Viewer: Occupation information,” https://jobs.utah.gov/jsp/ utalmis/#/occupation. Occupations included Athletes and Sports Competitors; Librarians; Library Assistants, Clerical; Library Technicians; Meeting, Convention, and Event Planners; Umpires, Referees, and Other Sports Officials; Zoologists and Wildlife Biologists; Tour Guides and Escorts; Actors; Amusement and Recreation Attendants; Art Directors; Athletic Trainers; Barbers; Curators; Dancers; Fitness Trainers and Aerobics Instructors; Hairdressers, Hairstylists, and Cosmetologists; Manicurists and Pedicurists; Massage Therapists; Museum Technicians and Conservators; Recreation Workers; Ushers, Lobby Attendants, and Ticket Takers
- ^Salt Lake County Board of Health, “Public health order 2020-05,” (Apr. 17, 2020), https://slco.org/globalassets/1-sitefiles/health/programs/covid/pho/pho5.pdf; Salt Lake County Board of Health, “Public health order 2020-06,” (Apr. 30, 2020), https://slco.org/globalassets/1-site-files/health/programs/ covid/pho/pho6.pdf.
- ^U.S. Bureau of Labor Statistics, “Local area unemployment statistics: Unemployment rates for states, seasonally adjusted,” (Sep. 11, 2020), https://www.bls.gov/web/laus/laumstrk.htm.