K-12 educational success is important to students and their families, but success is also important to the states and local taxpayers who fund education systems. Their investment is expected to pay dividends in producing an educated citizenry and a potent workforce.
Making the Grade? K-12 Outcomes and Spending in Utah uses Utah’s computer-adaptive assessment results to measure success, and then reaches beyond the state’s borders using national measures. Some assessments show that Utah compares well against the national average.
However, the U.S. as a whole may not be an appropriate comparison for Utah’s educational outcomes since this favorable comparison is likely due – in part – to certain socioeconomic and demographic factors. For a better comparison, Utah Foundation compares Utah both to other Mountain States and to selected educational peer states to account for socioeconomic and demographic differences.
The report also looks at the United States in comparison with its peers internationally and examines outcomes in the context of spending.
Key Findings
- In examining student outcomes overall, Utah compares well nationally and with Mountain States, and is about average when compared with peer states, which Utah Foundation determined using statistical analysis of five student demographic factors.
- Utah students improved over time on a statewide annual assessment, with an increase in proficiency during the five years that the test was administered. However, less than half of Utah’s students were proficient or better on the English, math and science tests.
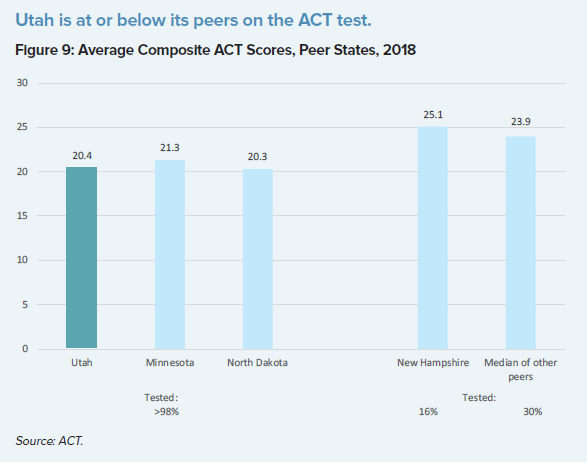
- Utah compares very well on ACT scores. Utah ranks third among the 19 states that test most of their high school graduates.
- In terms of high school graduation rates, Utah is among the top tier of Mountain States and in the middle of its peer states.
- Utah districts show a wide range of outcomes on the state’s annual assessment, student ACT scores and graduation rates.
- While Utah spends less – and in most cases far less – per pupil than the other Mountain States and its peer states, it performs respectably overall in terms of outcomes. And while higher-spending states tend to outperform the rest of the states, Utah outperforms higher-spending states collectively on several measures.
- While higher spending has limited links to better education outcomes, at some level spending can become decisive. Utah is the lowest in the nation in per-pupil K-12 operational education spending and therefore may fall short of its potential.
Download this report, here.
Comments:
3 Responses to “Making the Grade? K-12 Outcomes and Spending in Utah”
Robert G Kuesterman
The finding that Utah is about average among its peers would appear to be a great improvement from your study some years ago that found Utah was dead last among peer states.
It would be good to know how Utah figures have been affected by parental op-out of the tests.
Todd Hadden
It seems to me that the Headline should be “Utah has the Most Efficient Public School Spending in the Nation” Also my guess is
that if you look into it Connecticut’s spends a high percentage of
their budget on retirees’ health care and pensions. If Utah were
to double the money we pay to retired teacher I doubt we would increase performance in the classroom.
Shawn Teigen
Utah certainly is efficient.
We spend very little per pupil on admin, but we do actually spend more as a proportion of our spending on retirement; see our spending report from last year: https://www.utahfoundation.org/reports/k-12-education-spending-utah/
And we have a pretty great retirement package for teachers; see our recent teacher pension report: https://www.utahfoundation.org/reports/another-bite-at-the-apple-comparing-teacher-retirement-plans/
Thanks for reaching out.