Utahns have always ranked K-12 education as a one of their top three concerns in the Utah Priorities Project. In 2016, K-12 education ranked third.
Survey Responses
Level of Concern
In the Utah Priorities Project, over two-thirds (68%) of Utahns had a high level of concern for K-12 education (rating it a 4 or 5 on a 5-point scale). Liberal respondents were slightly more concerned than moderate and conservative respondents, but over 81% of “very liberal” respondents were concerned. Women were more concerned than men (74% compared to 61%), and voters whose children are currently in public education were also more concerned. Voters working part-time also tended to be more concerned than those working full-time.
Raise Taxes?
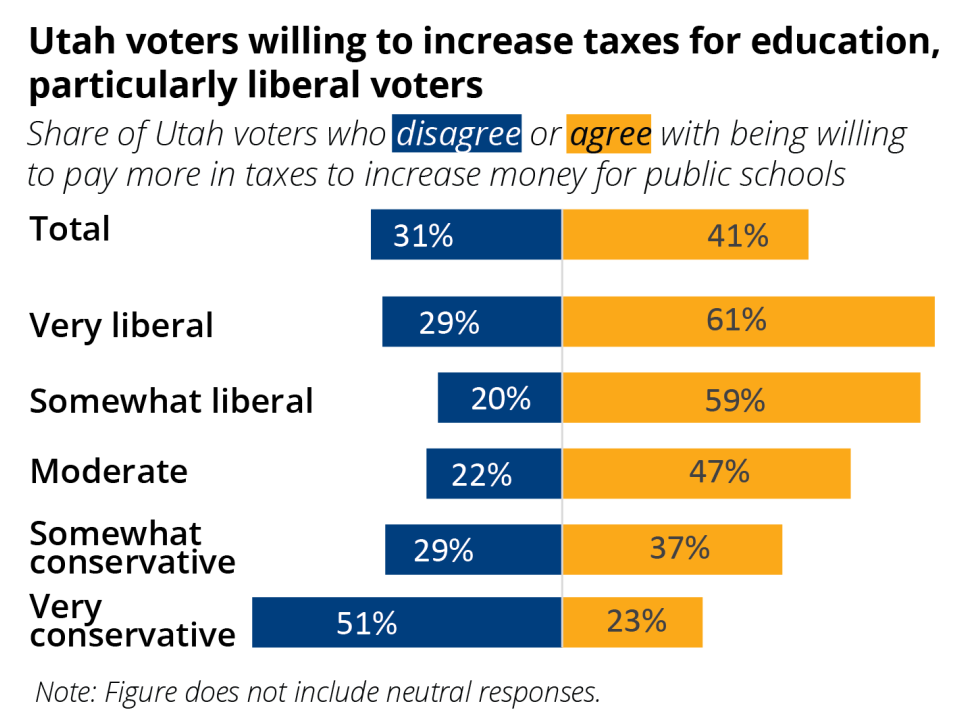
When asked if they agreed with the statement “I would be willing to pay more taxes to increase funding for public schools,” 41% agreed and 31% disagreed
![]() . Liberal voters were more likely to agree than conservative voters, and respondents with higher incomes were more likely to agree. Part-time workers were more likely than full-time workers to support higher taxes to pay for education, while homemakers were less likely than full-time workers.
. Liberal voters were more likely to agree than conservative voters, and respondents with higher incomes were more likely to agree. Part-time workers were more likely than full-time workers to support higher taxes to pay for education, while homemakers were less likely than full-time workers.
In a related question, when voters were asked whether they agreed that “Utah should reduce taxes and reduce spending,” more than twice as many agreed as disagreed (47% to 20%). While Utah voters might generally be in favor of a lower level of taxation and state government spending, it appears that they become more willing to raise taxes on the condition that this new revenue is dedicated to education.
Utah has the lowest per pupil funding in the nation. Further, Utah Foundation analysis shows that the share of Utahns’ income that funds education has declined since the mid-1990s, from 7th in the nation to 37th.1 The Utah Legislature and Governor increase education funding most years, and while the past few years of increases might seem significant, student enrollment growth and inflation absorbs most of the funding increases.2
The Common Core
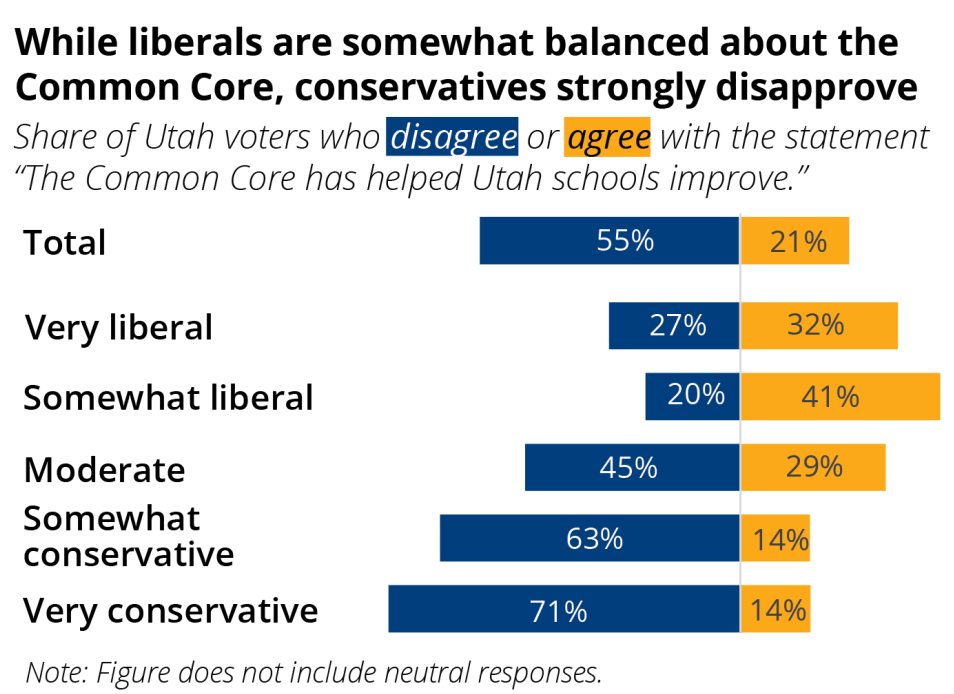
Only 21% of Utah voters felt that the Common Core has helped Utah schools improve, while 55% disagree![]() . While more liberal voters are more likely to agree that it has helped schools improve, the inverse is true for conservative respondents.
. While more liberal voters are more likely to agree that it has helped schools improve, the inverse is true for conservative respondents.
Political party alignment had similar results to the ideological one. Of Democratic respondents, 39% agreed that the Common Core was helpful while 25% disagreed. Only 16% of Republicans agreed while 61% disagreed.
But what is the Common Core? It is a set of standards from the Common Core State Standards Initiative that detail what K-12 students should know at the end of each grade in math and English classes. While many think the initiative is imposed by the federal government, it is largely a collaboration among states incentivized by the U.S. Department of Education. Utah amended its existing standards to align with the Common Core standards for math and English in 2010.
Education Priorities
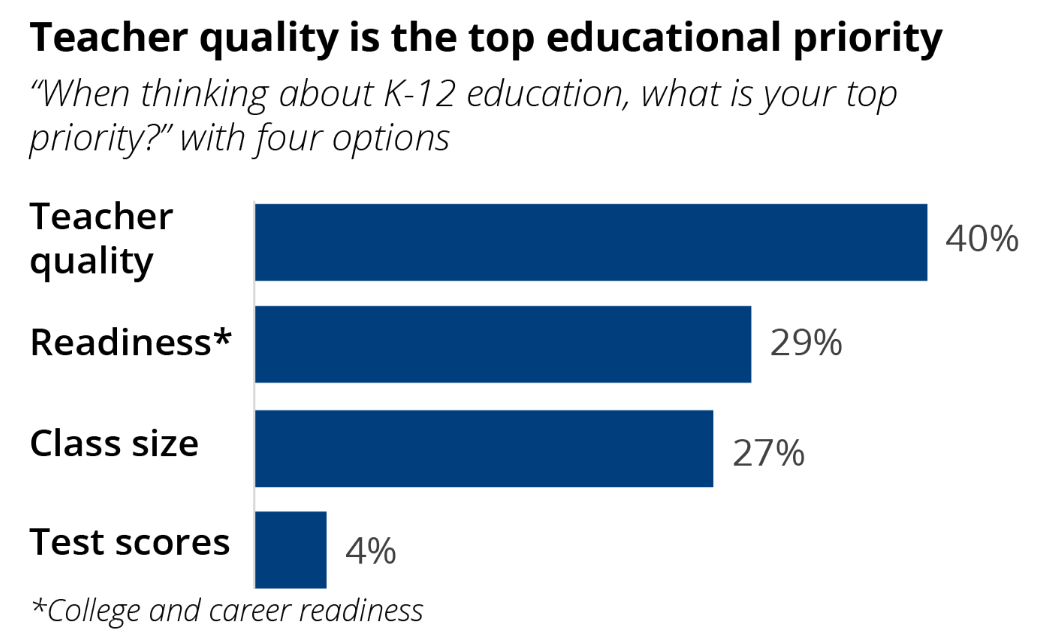
Where should Utah focus its K-12 efforts? Utah Priorities Project respondents indicated that teacher quality is most important, with college and career readiness and class size not far behind![]() . Men were more likely than women to feel that teacher quality was a priority (44% compared to 36%). Men were far less likely to prioritize class size (18% compared to 36%). Conservative voters were also less likely than liberal voters to prioritize class size (23% compared to 33%).
. Men were more likely than women to feel that teacher quality was a priority (44% compared to 36%). Men were far less likely to prioritize class size (18% compared to 36%). Conservative voters were also less likely than liberal voters to prioritize class size (23% compared to 33%).
Enrollment Increases and Teacher Shortages
Respondents’ priority of teacher quality may be affected by a district’s inability to find qualified teachers. This is related to the priority of class size, as well as to enrollment growth and other issues that may affect teacher shortages.
Utah is one of the fastest growing states in the nation.3 The state has added 1 million additional residents since 1995, officially hitting the 3 million mark in 2016.4 Utah’s population is expected to continue to grow into the future.5 This population growth means increasing school enrollment. Total enrollment has been growing at approximately 2% per year, equating to over 100,000 students over the past 10 years to a total of 643,625 students in 2016.6
An average of 500 new teaching positions are created each year in districts across the state to accommodate enrollment growth.7 In addition, Utah sees 1,000 annual teacher retirements.8 Fortunately, there are approximately 2,500 teachers recommended for licensure each year.9 Nonetheless, many districts feel the teacher pipeline is not sufficient. Nearly half of Utah school districts indicated that they did not have certified teachers in every classroom, and nine in ten districts indicated that the pool of qualified applicants has been shrinking.10 Another key issue is Utah’s retention rate. By the end of their 5th year, 40% of new public school teachers have left their jobs.11 This adds to the annual need for new teachers.
There are numerous factors that affect retention rates, including compensation levels and working conditions. Utah ranks 34th in average teacher salaries and 36th in starting teacher salaries – lower than all of the states in the West.12 In addition, according to the Economic Policy Institute, the U.S. wage gap between public school teachers’ wages and what they could potentially make in the private sector has increased to 17% in 2015, doubling since 1996. This wage gap is even larger in Utah.13
Working conditions include such things as class size and sufficiency of professional development. The elementary and secondary pupil-teacher ratio in Utah public schools in 2015 was 22.14 This is strikingly high compared to the national average of 16, leaving Utah with the second highest teacher-pupil ratio in nation.15 Furthermore, state support for professional development funding was eliminated nearly a decade ago.
In response to teacher shortages, the number of alternatively credentialed teachers has been increasing to help fill the gap.16 In 2016 the Utah State Board of Education opened up another alternative path to teaching.17 It is unclear how alternative routes affect teacher quality – the primary educational concern of Utah voters.
The limited number of high-quality available teachers is being addressed in education reform efforts that are underway, including Prosperity 2020’s plan for improving educational outcomes. The Governor’s Education Excellence Commission is also working toward a comprehensive plan. These plans include measures that would require additional education funding. Future legislatures will determine whether money will be available for Utah schools through higher taxes or reallocation of current funds.
This research brief was written by Utah Foundation Research Director Shawn Teigen.
- ^ Utah Foundation defines funding effort as the proportion of Utahns’ incomes that is dedicated to funding education.
- ^ Utah Foundation calculations.
- ^ U.S. Census Bureau, http://www.census.gov/popest/data/state/totals/2015/index.html (accessed on August 9, 2016).
- ^ Governor’s Office of Management & Budget, Economic Indicators for Utah and the United States, http://gomb.utah.gov/wp-content/uploads/sites/7/2016/05/ecin2016-05.pdf (accessed on August 2, 2016).
- ^ Governor’s Office of Planning and Budget, 2012 Baseline Projections, http://gomb.utah.gov/budget-policy/demographic-economic-analysis/ (accessed on August 2, 2016).
- ^ Utah State Board of Education, Data Reports- Enrollment and demographics, http://www.schools.utah.gov/data/Reports/Enrollment-Demographics.aspx (accessed on August 2, 2016).
- ^ Utah Education Policy Center, At First Glance: Teachers in Utah, http://uepc.utah.edu/_documents/uepc_teacher_shortages.pdf (accessed on September 7, 2016).
- ^ Ibid.
- ^ Ibid.
- ^ Ibid.
- ^ Ibid.
- ^ National Education Association, Estimates of School Statistics, 1969-70 through 2012-13. (This table was prepared April 2013). Retrieved from: https://nces.ed.gov/programs/digest/d13/tables/dt13_211.60.asp. Last accessed on July 28, 2016, and NEA Collective Bargaining/Member Advocacy’s Teacher Salary Database, based on affiliate reporting as of December 2013. Retrieved from http://www.nea.org/home/2012-2013-average-starting-teacher-salary.html. Last accessed on July 28, 2016
- ^ Economic Policy Institute, The Teacher Pay Gap is Wider than Ever. http://www.epi.org/publication/the-teacher-pay-gap-is-wider-than-ever-teachers-pay-continues-to-fall-further-behind-pay-of-comparable-workers/ (accessed September 28, 2016)
- ^ Utah State Board of Education, http://www.schools.utah.gov/data/Reports/Class-Size.aspx (accessed on September 21, 2016).
- ^ U.S. Department of Education, National Center for Education Statistics, Common Core of Data (CCD), “State Nonfiscal Survey of Public Elementary/Secondary Education,” 2000-01 through 2013-14, https://nces.ed.gov/programs/digest/d15/tables/dt15_208.40.asp?current=yes (accessed July 28, 2016).
- ^ Utah Education Policy Center, At First Glance: Teachers in Utah, http://uepc.utah.edu/_documents/uepc_teacher_shortages.pdf (accessed on September 7, 2016).
- ^ Utah Administrative Code, Rule R277-511, http://www.rules.utah.gov/publicat/code/r277/r277-511.htm (accessed on September 23, 2016).