Part I: Priorities Survey Reveals Divergent Housing Affordability Concerns by Age, Political Viewpoint, Ethnicity
Utah Foundation had asked about housing prices in its 2008, 2010 and 2012 Utah Priorities Project surveys but housing had never been one of the top 10 issues. However, housing affordability was the second most important issue to Utah voters in early 2020.
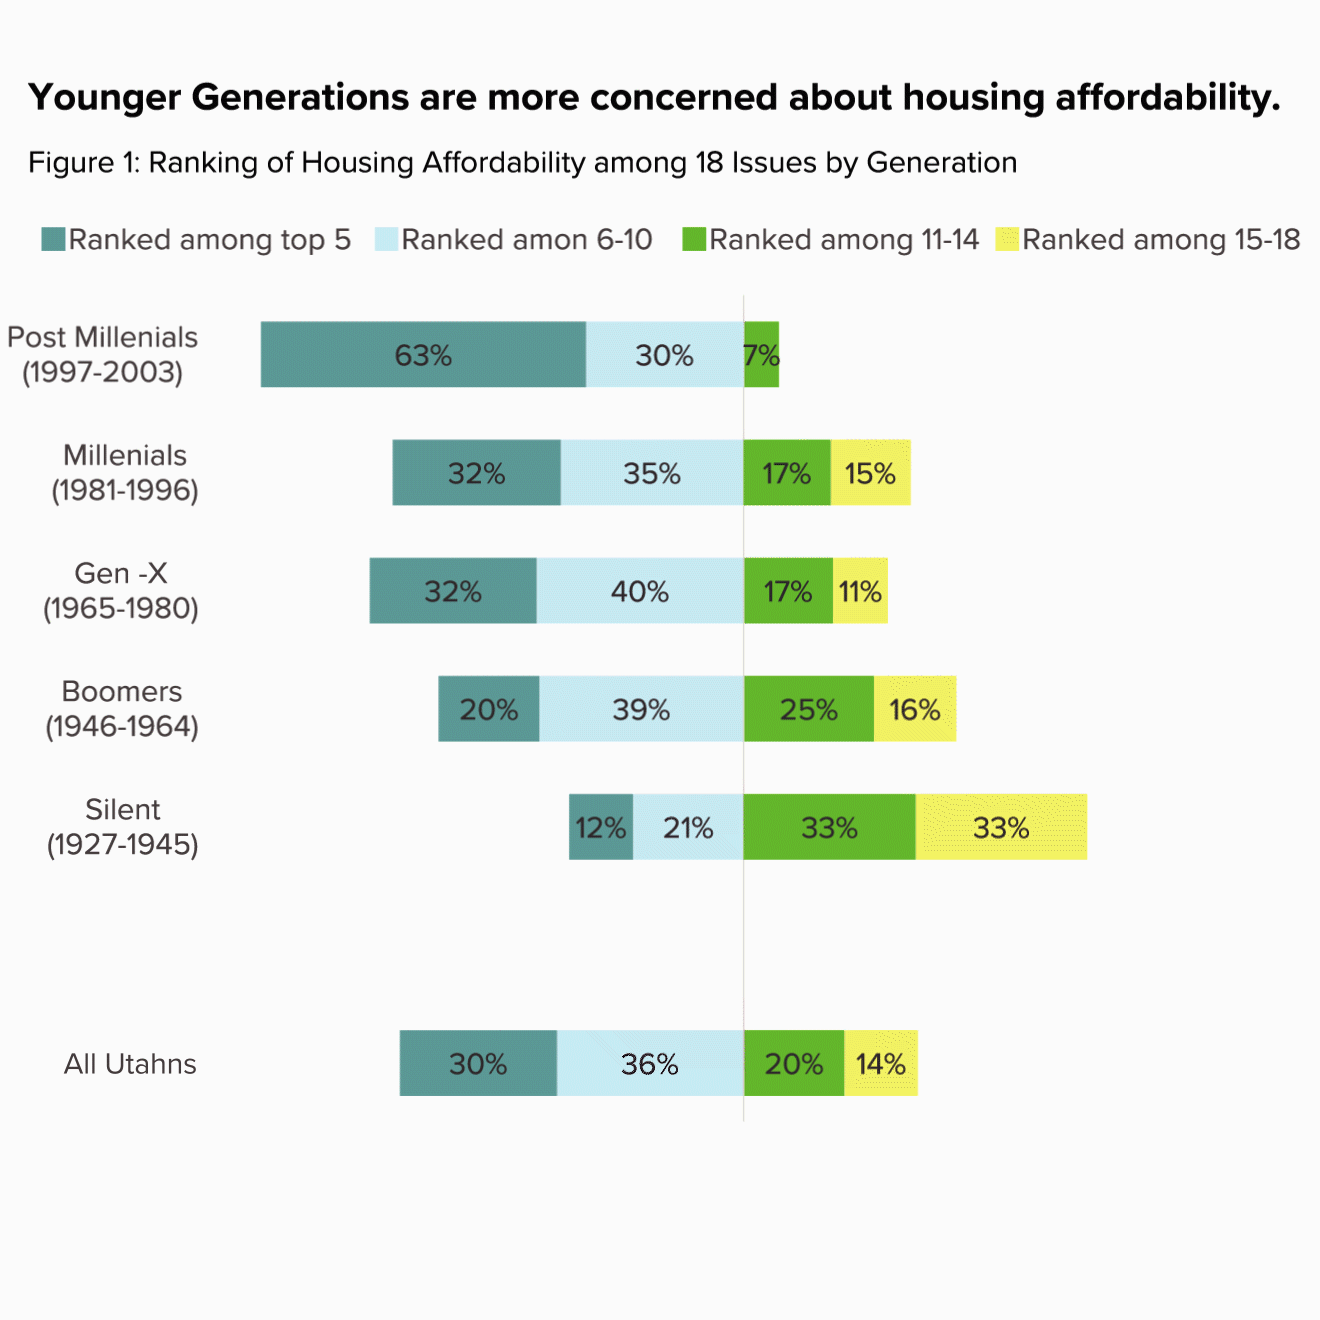
With the emergence of the coronavirus, concerns about housing affordability dropped to 7th – with just under one-third of Utahns ranking it in the top 5. (See Figure 1 in Part I.) Interestingly, housing affordability was one of the few topics that did not differ along ideological lines. It did, however, differ along generational divisions, with younger generations much more likely to rank housing affordability among their top 10 issues.

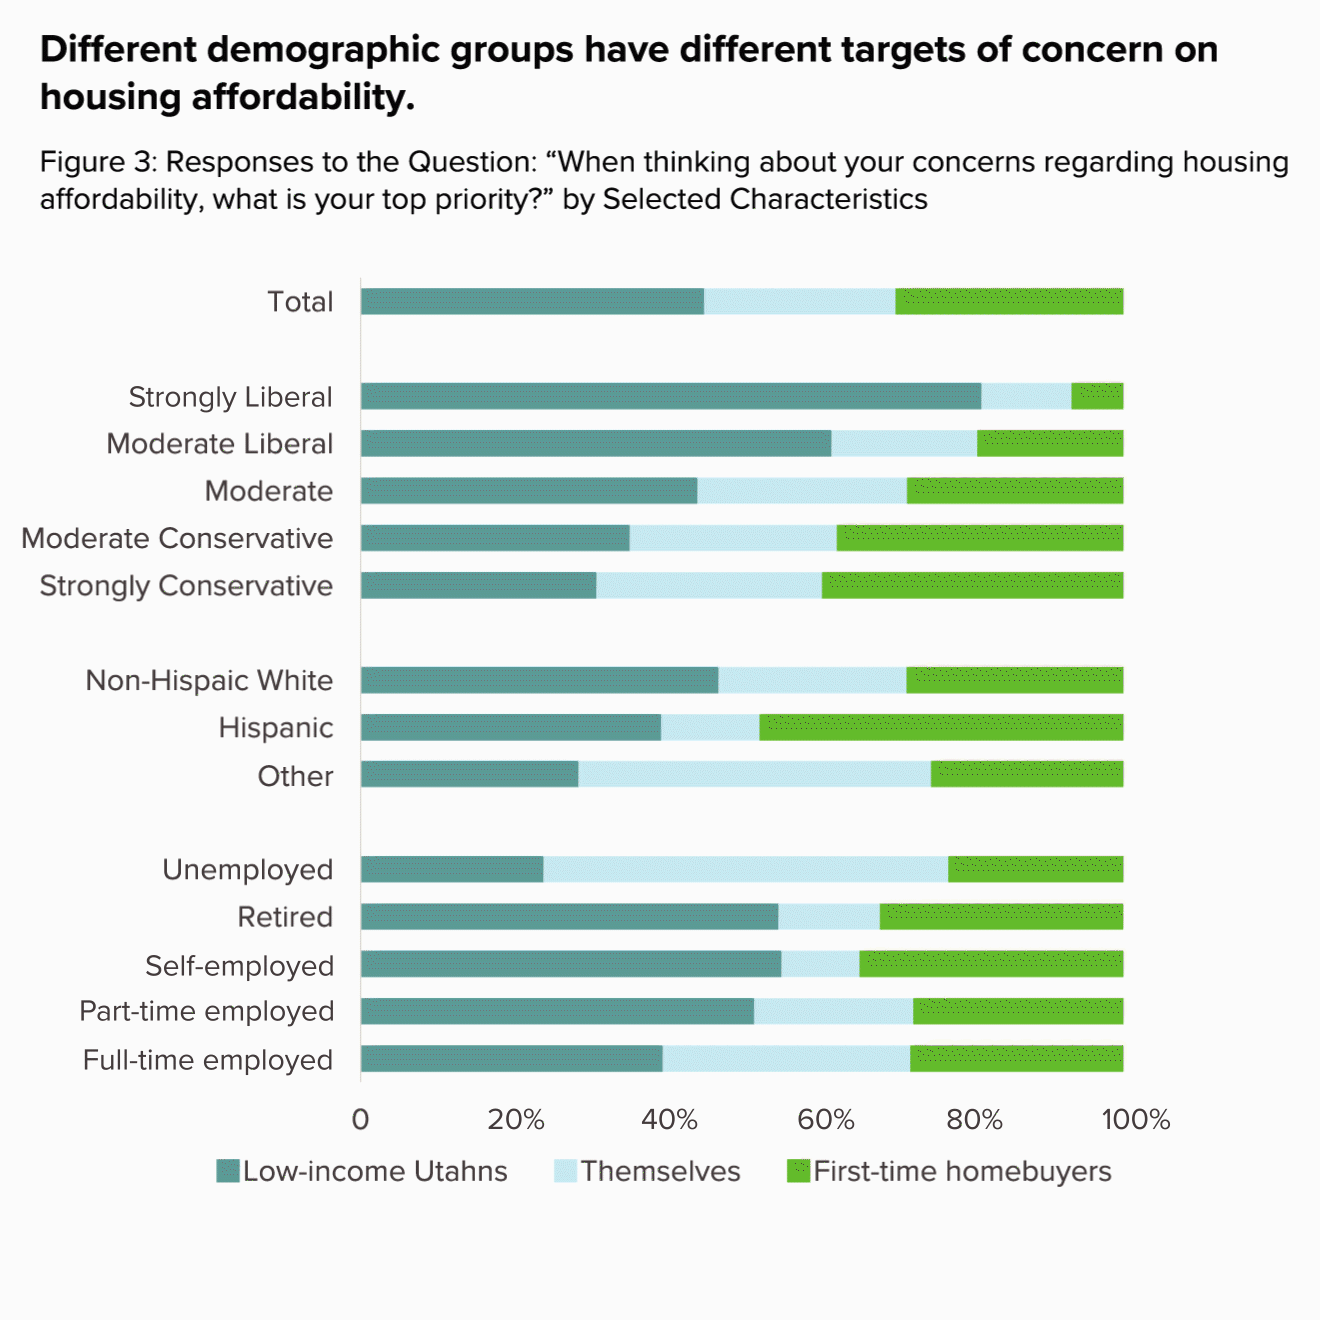
In our pre-pandemic survey, we asked Utah voters who they would prioritize when thinking about housing affordability. Just under half would prioritize low-income Utahns, just under a third would prioritize first-time home buyers, and a quarter of Utah voters were worried about the affordability of their own housing.
Those who were more likely to prioritize affordable housing for first-time home buyers included conservative voters, Hispanic voters and married voters. Those who prioritized housing affordability for themselves included conservative voters, voters who were neither non-Hispanic white nor Hispanic, unemployed voters, and Gen-x and Millennial voters. Those who prioritized housing affordability for low-income Utahns were liberal voters, white voters, part-time and self-employed workers, single voters, and voters who did not identify with a religion.
Part II: Rents in Salt Lake Area Expensive from a National Perspective, but not among Mountain State Peers
Previous Utah Foundation research indicated that housing affordability was of much greater concern among renters than homeowners. While the increasing cost of owning a home is potentially offset by record low interest rates, there is no such offset for renters.
The U.S. Department of Housing and Urban Development uses a national survey to calculate the Fair Market Rent, set to reflect the cost of rent for below-average, but reasonably-quality rental residences including utilities (read more about the methodology).
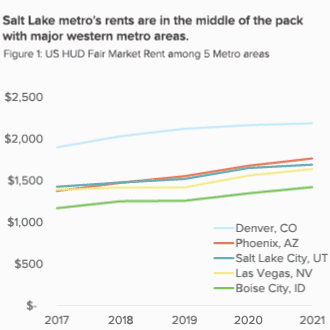
In 2021 the Salt Lake metro area had a fair market rent of $1,690 for a 3-bedroom residence. This is among the most expensive areas calculated in the U.S. – more expensive than 94% of the other areas measured. However, when comparing the Salt Lake metro area’s fair market rent over the past five years to other regional metropolitan areas, it falls among the middle of the pack.
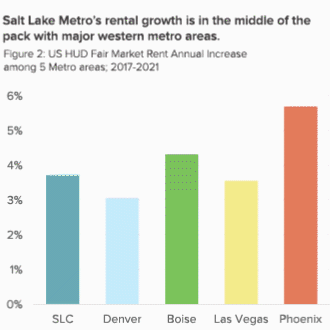
The data tell a similar story when looking at the fair market rent’s rate of increase over the past five years.
The coronavirus pandemic introduced a lot of uncertainty into the picture in 2020 and 2021. If the pandemic had produced a standard economic recession, rental rates would have been expected to fall (backup link) as families would have been forced to move out of existing housing and double up with friends or family. However, this has not been the case as rental prices have continued to increase across all five metro areas from 2019 through 2021. This could be due to the quick economic recovery Utah experienced, the availability of rental assistance, or moratoria on evictions.
Additionally, while rents are still increasing, trends across large metro cities in the West do show the rates of growth falling beginning May and June of 2020. Cities in the U.S. Census West region of the United States saw rents increase from 4% to 6% annually from 2017 to 2019, but current rates of growth (January 2021) are under 2%.
Part III: 2020 a Standout Year for Home Sale Price Escalation
Based on data collected by Redfin (a real estate brokerage that publishes national housing data), Utah’s housing prices skyrocketed in 2020. (See Figure 1 in Part III.)
A study by bankrate.com found that over the course of 2020, Utah’s home home values increased by 15.4 percent, which was the third-highest increase among U.S. states. As part of its “Housing Heat Index” it also looked at job growth (Utah had the second highest), unemployment (Utah had the fifth lowest) and tax burden (Utah had the 8th lowest). These factors ranked Utah first in the study’s “Housing Heat Index.”
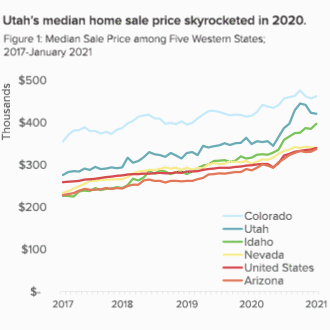
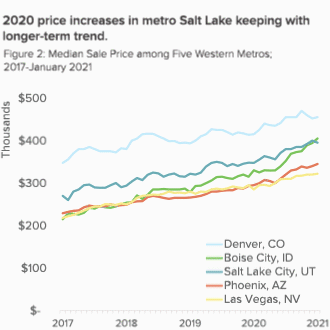
Much of Utah’s increase seem to have been driven by high-priced second homes in Summit and Wasatch counties. If you look at the housing prices in the Mountain State Region’s major metropolitan areas, increases are still present, but the Salt Lake City area is more in line with comparable locations. (See Figure 2 in Part III)
Utah’s monthly supply of housing stock (how long the inventory of houses will take to be sold based on current sale trends) is at historic lows. It is a trend the United States is seeing as a whole, but is dramatic in the Mountain States. (See Figure 3 in Part III.)
Low monthly supply is a determined by the number of houses being listed, how long they remain on the market, and the number of buyers. The number of houses being listed is slightly above average, so it appears the current housing crunch is primarily driven by higher levels of demand.

One theory commonly floated about the current crunch is that the higher levels of remote work have allowed workers to leave higher-density cities for locations with good job opportunities and a higher quality of life – both strong points for Utah, though Utah Foundation is unaware of any data supporting the theory itself.
A second factor for the housing crunch more broadly is record low interest rates. In May, the average 30-year fixed mortgage rate broke previous records and has since continued to fall.
Part IV: Are Californians to Blame for Salt Lake’s Rising Housing and Rental Rates?
Why are we seeing these increases? The Utah Foundation has looked at whether it might be due to an influx of Californians. That does not seem to be the whole answer. When looking at Utah’s larger metropolitan areas, the recent rate of people moving in is actually down. The recent increase in demand is actually due in part to fewer residents than normal leaving – particularly in the Salt Lake area – thus pushing up housing costs and rent.
Some have put the blame for the increase on California, claiming that residents of its large urban areas are now freed through the increase in remote work and are looking to move to other areas with a lower cost of living such as Idaho and Utah – thereby increasing housing demand and prices. However, an analysis of USPS change-of-address data indicates that Nevada, Arizona and New Mexico are the top states for inbound migration in the region. An analysis of data from the moving-company United indicates Oregon, Idaho and Arizona were the stop target states in the region. On the other hand, another moving-company, Atlas, includes Utah along with Idaho and Nevada as the primary targets for western states.
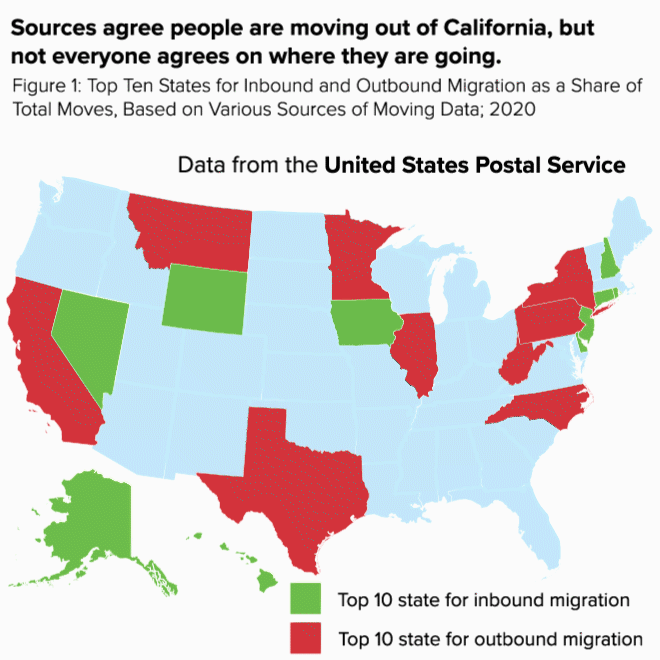
Source: Realtors using USPS change-of-address, United using their out-of-state moving data, and the Tax Foundation using out of state moving data from Atlas.
Allconnect Inc., also analyzed USPS data in 2020. They found that more people moved out of the biggest cities than moved in, while smaller cities and suburbs grew — especially in Arizona, Florida and Texas. Remote work was a major motivator for moves during 2020, and the suburbs that gained movers tended to have faster internet speeds.
Nonetheless, Utah is not among the top 10 states for inflow among any of these measurements. (See Figure 1 in Part IV.) If Utah had been a top destination for Americans, it could help explain the rising housing prices and rental prices mentioned in previous posts. However, Utah was far exceeded by some of its neighbors.

Note: Change in net flow is change in inflow subtracted by change in outflow.
Since previous Utah Foundation surveys indicated that the Salt Lake Metro area has a high level of concern regarding housing affordability, Utah Foundation looked to studies focused on migration patterns across metropolitan areas. A study by the Federal Reserve Bank of Cleveland (based on consumer credit information) found that among the 96 largest metropolitan areas in 2020, most lost population. For instance, in the San Francisco Bay area, the net change has favored smaller metropolitan areas in California. However, for the most part, rather than a mass movement out of large cities, the lost was more related to a decreased inflow among large metros. (See Figure 2 in Part IV.)
The Provo-Orem metro area was a prime example of this trend, with the 17th highest net decrease out of nearly 100 large metro areas (with over half a million people). The area saw a net decrease of 31 people per 100,000 people, largely driven by 39 fewer people per 100,000 moving into the metro area.
The Ogden-Clearfield area had inflows and outflows similar to past years.
The Salt Lake metro area bucked the national trend. It saw the fifth highest growth per 100,000 people out of nearly 100 cities. But is it Californians driving that growth? Not likely. During 2020, fewer people actually moved into the Salt Lake metro when compared to past years. Most of that population growth is linked to fewer people leaving (20 people per 100,000 people). And fewer people leaving is functionally equivalent to more people coming in.
So, it turns out that for 2020, Salt Lake metro residents are to blame (at least in part) for rising housing and rental prices because they have not moved out at a similar pace as in previous years.
Written by Senior Analyst Christopher Collard and Research Assistant Todd Christensen.
This research brief is a compilation of four of Utah Foundation’s Significant Statistics blog posts from March and April, 2021.